Atomic Red Team vs. My Splunk Detections: What Actually Fired
I ran 12 attack techniques against a Windows server with my eight Splunk detections watching. Seven of my eight detections fired; the eighth missed for a subtle reason worth the whole post. Here's what fired, what didn't, and why.
Writing a detection is the easy part. Knowing whether it works is the hard part, because “no alerts” looks exactly the same whether you’re safe or blind. The only honest way to find out is to do the thing the detection is supposed to catch and see what happens.
That’s what this post is. I took the Windows server from this series, which has Sysmon, PowerShell Script Block Logging, and the license filters from post 2 all in place, and ran real attack techniques against it with Atomic Red Team. Then I checked every one against my eight detections.
Where this fits. Last post in the Splunk series. Post 1 onboarded the server, post 2 cut the license cost, post 3 wrote the detections in SPL and KQL, and this one checks them.
The Setup
Atomic Red Team is Red Canary’s free library of small, safe tests, each one mapped to a specific MITRE ATT&CK technique. Invoke-AtomicTest T1003.001 runs a credential-dumping technique the same way an attacker would, then cleans up after itself. It’s the standard way to check detection coverage without hiring a red team.
A few ground rules I set so the results mean something:
- Microsoft Defender stayed on. The only change was an exclusion for the Atomic Red Team folder itself, which is Red Canary’s own guidance, so the test files don’t get deleted before they run. If Defender blocks a technique at runtime, that’s a real result and I record it.
- The license filters from post 2 stayed on. If cutting 80%+ of the ingest cost me visibility, this is where it would show.
- Every test was timestamped. The runner script logs when each test started and ended, so every alert can be tied back to the test that caused it, and every miss is a real miss.
- I included techniques I hadn’t written detections for. Registry Run keys and log clearing aren’t covered by any of my eight rules. Leaving them in keeps the score honest, and a known gap is more useful than a perfect-looking scorecard.
One wrinkle: Red Canary’s upstream repo no longer includes the T1562.001 (defense tampering) or T1070.001 (log clearing) folders. I ran those three as custom tests using the same commands the old atomics used, and they’re labeled that way below.
The Detections Under Test
| # | Detection | ATT&CK | Kill Chain phase |
|---|---|---|---|
| D1 | Encoded PowerShell command line | T1059.001 | Installation |
| D2 | Suspicious PowerShell script block | T1059.001, T1562.001 | Delivery / Installation |
| D3 | Defender tampering | T1562.001 | Actions on Objectives |
| D4 | Local account created | T1136.001 | Installation (persistence) |
| D5 | Scheduled task created from command line | T1053.005 | Installation (persistence) |
| D6 | LSASS dump via comsvcs MiniDump | T1003.001 | Actions on Objectives |
| D7 | Discovery burst (4+ recon tools, one parent, 5 min) | T1087, T1082, T1016, T1033 | Reconnaissance (internal) |
| D8 | Password guessing (10+ failed logons in 10 min) | T1110.001 | Exploitation |
I mapped each one to both ATT&CK and the Lockheed Martin Cyber Kill Chain. ATT&CK says what the attacker did. The Kill Chain says how far along they are, which is what decides how urgently a SOC should move. A discovery burst means someone is getting their bearings. An LSASS dump means they’re already taking credentials.
The Results
| # | Detection | Technique | Result | What caught it |
|---|---|---|---|---|
| D1 | Encoded PowerShell | T1059.001 | Fired | 17 events, incl. the -EncodedCommand my own remote tooling used |
| D2 | Suspicious script block | T1059.001 / T1562.001 | Fired | 34 events: Invoke-Mimikatz, AMSI bypass, download cradles, reflective loads |
| D3 | Defender tampering | T1562.001 | Fired | Set-MpPreference -DisableRealtimeMonitoring |
| D4 | Local account created | T1136.001 | Fired | new user T1136.001_CMD (Event 4720) |
| D5 | Scheduled task created | T1053.005 | Fired | two tasks (onstart, onlogon) |
| D6 | LSASS dump (comsvcs) | T1003.001 | Fired | rundll32 comsvcs.dll MiniDump |
| D7 | Discovery burst | T1087/T1082/T1016 | Missed, then fixed | see below |
| D8 | Password guessing | T1110.001 | Fired | 25 failed logons, 3 accounts, one source |
| — | Registry Run key | T1547.001 | No detection (known gap) | I didn’t write one |
| — | Clear event log | T1070.001 | No detection (known gap) | I didn’t write one |
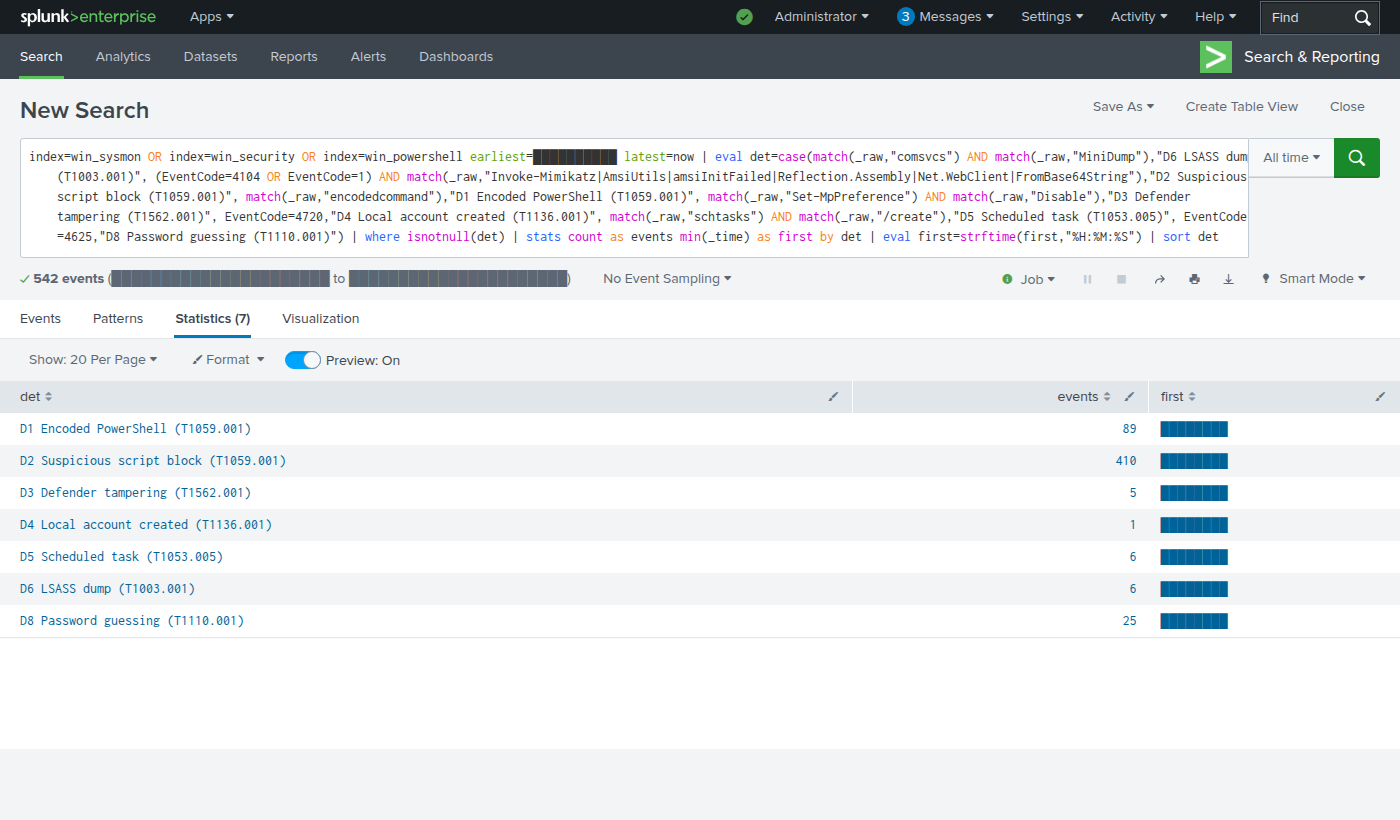
Seven of the eight detections fired on the first pass. One missed, which turned out to be the most useful result of the night. The two techniques I hadn’t written rules for went by unseen, exactly as expected, which is the point of leaving them in.
The Interesting Ones
D6, LSASS dumping, is the one I most wanted to see. Defender actually blocked the comsvcs.dll dump at runtime (Trojan:Win32/RundllLolBin.AF), but the command line was still recorded by Sysmon and Security 4688, so the detection fired anyway. That’s the whole argument for a SIEM sitting behind an EDR: the EDR stops the payload, and the SIEM records the attempt so a human finds out it happened. Same story for Mimikatz (Defender flagged Trojan:PowerShell/Mimikatz.A) and the AMSI bypass, both blocked, both still logged, both caught by D2.
D3 caught Defender being turned off, from inside PowerShell. The Set-MpPreference -DisableRealtimeMonitoring $true succeeded, and the detection fired on it. If an attacker’s first move is to blind the EDR, that action itself has to be the alarm, because everything after it is running in the dark.
The gaps behaved. Registry Run-key persistence (T1547.001) and clearing the System event log (T1070.001) both ran and neither fired, because I never wrote detections for them. They’re on the to-do list now, which is exactly what an honest coverage test is for.
Closing a Gap
The interesting miss was D7, the discovery burst. During the run, the System Information Discovery test fired off ten recon tools in about a minute (arp, ipconfig, net, reg, systeminfo, tasklist, wmic, whoami, and more). My detection should have screamed. It said nothing.
The reason was one word in the query. I had grouped by parent process:
... | stats dc(Image) as distinct_tools by _time Computer ParentProcessGuid ParentImage User
That assumes the recon tools share a parent. But Atomic (like a lot of real tooling) launches each command as its own separate cmd.exe /c, so every tool had a different parent process GUID. Grouped that way, each parent saw exactly one tool, and the threshold of four was never close.
The fix is to stop caring who the parent was and count distinct recon tools per host and user in the window:
... | bin _time span=5m
| eval exe=lower(mvindex(split(Image,"\\"),-1))
| eval exe=if(exe=="net1.exe","net.exe",exe)
| stats dc(exe) as distinct_tools values(exe) as tools by _time Computer User
| where distinct_tools >= 4
That immediately caught the attack (nine distinct tools, Administrator). But it introduced a false positive: my own activity simulator runs ipconfig, net, and whoami every minute, and because net.exe automatically spawns net1.exe, that innocuous trio counted as four tools and tripped the rule. The last fix collapses net1.exe into net.exe, since it’s just net’s helper, not a separate tool. After that, normal activity produces three distinct tools (quiet) and the attack produces nine (fires). That progression, too tight, then too loose, then right, is what tuning a detection actually looks like.
The Same Results in KQL
In post 3 I rewrote all eight detections in KQL. I loaded this attack run into the Kusto emulator and ran both versions against the same events:
All eight detections returned the same number of hits in both languages once I’d translated them carefully:
| Detection | SPL | KQL |
|---|---|---|
| D1 Encoded PowerShell | 17 | 17 |
| D2 Suspicious script block | 34 | 34 |
| D3 Defender tampering | 6 | 6 |
| D4 Local account | 1 | 1 |
| D5 Scheduled task | 2 | 2 |
| D6 LSASS dump | 1 | 1 |
| D7 Discovery burst | 2 | 2 |
| D8 Password guessing | 1 | 1 |
Getting D2 and D3 to match took a real fix: KQL’s has matches whole terms, so has "Reflection.Assembly" missed events where the text was Reflection.AssemblyName, and has "Disable" missed DisableRealtimeMonitoring. Switching those to contains (true substring, like Splunk’s *...*) brought both to parity. That’s written up in post 3.
What I’d Take Into a SOC
- Test detections by doing the thing. Nothing I wrote was “done” until I’d watched it fire on the real technique, and seen what it missed.
- Keep misses in the scorecard. The gaps are the most useful rows in the table. They’re the to-do list.
- Map to the Kill Chain, not just ATT&CK. Both matter, but the Kill Chain phase is what decides how fast someone should pick up the phone.
- Filters have to be proven against attacks, not just against normal traffic. Post 2’s filters looked safe on paper. This is where they were actually checked.