Which Logs Are Worth the License? Measuring What Each Windows Source Costs in Splunk
I measured what every Windows event source cost on a freshly onboarded client, found that about three quarters of the ingest was PowerShell logging its own auto-generated code, and cut 84% of the daily volume without losing a single detection.
Splunk charges by how much data you put into it per day. Not by how many hosts, not by how many searches. Gigabytes in. That one fact shapes almost every conversation between an MDR provider and a client about what to collect, because the answer to “should we collect this?” is never just “is it useful?” It’s “is it useful enough to pay for every day, forever?”
In the last post I onboarded a Windows server into a dedicated Splunk instance with Security, System, Sysmon, and PowerShell logs each going to their own index. This post answers the question that comes right after: what does each of those sources actually cost, and what can go without hurting detection?
Where this fits. Second post in the Splunk series. Post 1 got the data in. This one decides what to keep. Post 3 writes the detections, and post 4 proves they still fire after the filtering here.
How I Measured It
A fair measurement needs two things: the same workload before and after, and a way to count bytes.
The workload. An idle server barely logs anything, so measuring one would tell me nothing. I set up a scheduled task that runs every minute as SYSTEM and does the kind of light admin activity a real server sees: lists processes and services, runs whoami, net user, and ipconfig, resolves a DNS name, writes a file, and lists a directory. It ran unchanged through both measurement windows.
The windows. One hour collecting everything unfiltered (the baseline), then one hour with filters applied, same workload.
The bytes. Splunk writes its own license accounting to license_usage.log in the _internal index, broken down by index, sourcetype, source, and host. That’s what the bill is based on, so that’s what I measured:
index=_internal source=*license_usage.log type=Usage idx=win_*
| stats sum(b) as bytes by idx
| eval MB=round(bytes/1024/1024,2)
License usage only tells you which index is expensive, though, not why. For that I went a level deeper and measured the size of every event by Event ID:
index=win_* sourcetype=XmlWinEventLog
| eval bytes=len(_raw)
| stats count sum(bytes) as bytes by index EventCode
| sort - bytes
The Baseline: One Source Ate Everything
Over the one-hour baseline, the four sources broke down like this:
| Index | MB in the hour | Share of ingest |
|---|---|---|
win_powershell |
11.02 | 72.2% |
win_sysmon |
3.10 | 20.3% |
win_security |
1.11 | 7.3% |
win_system |
0.02 | 0.2% |
| Total | 15.26 |
That’s about 366 MB a day from one server, measured from Splunk’s own license log.
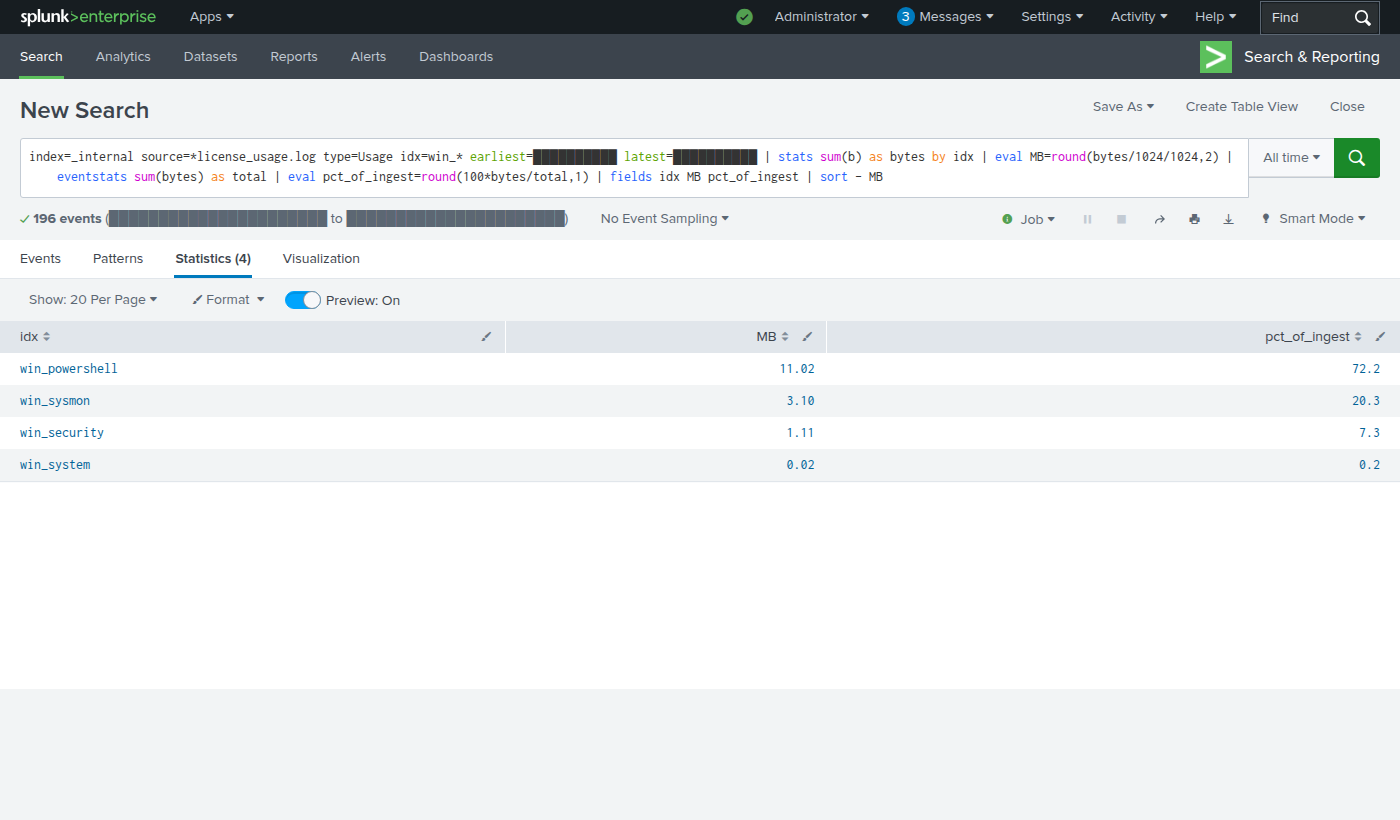
I expected Sysmon to be the expensive one, since it’s famous for being chatty. It wasn’t close. PowerShell was 72% of all ingest, and almost all of that was a single Event ID: 4104, Script Block Logging.
That was surprising, because the workload runs one short PowerShell command a minute. So I looked at which script blocks were costing the most:
index=win_powershell EventCode=4104
| eval bytes=len(_raw), head=substr(replace(ScriptBlockText,"\s+"," "),1,110)
| stats count sum(bytes) as bytes by head
| sort - bytes
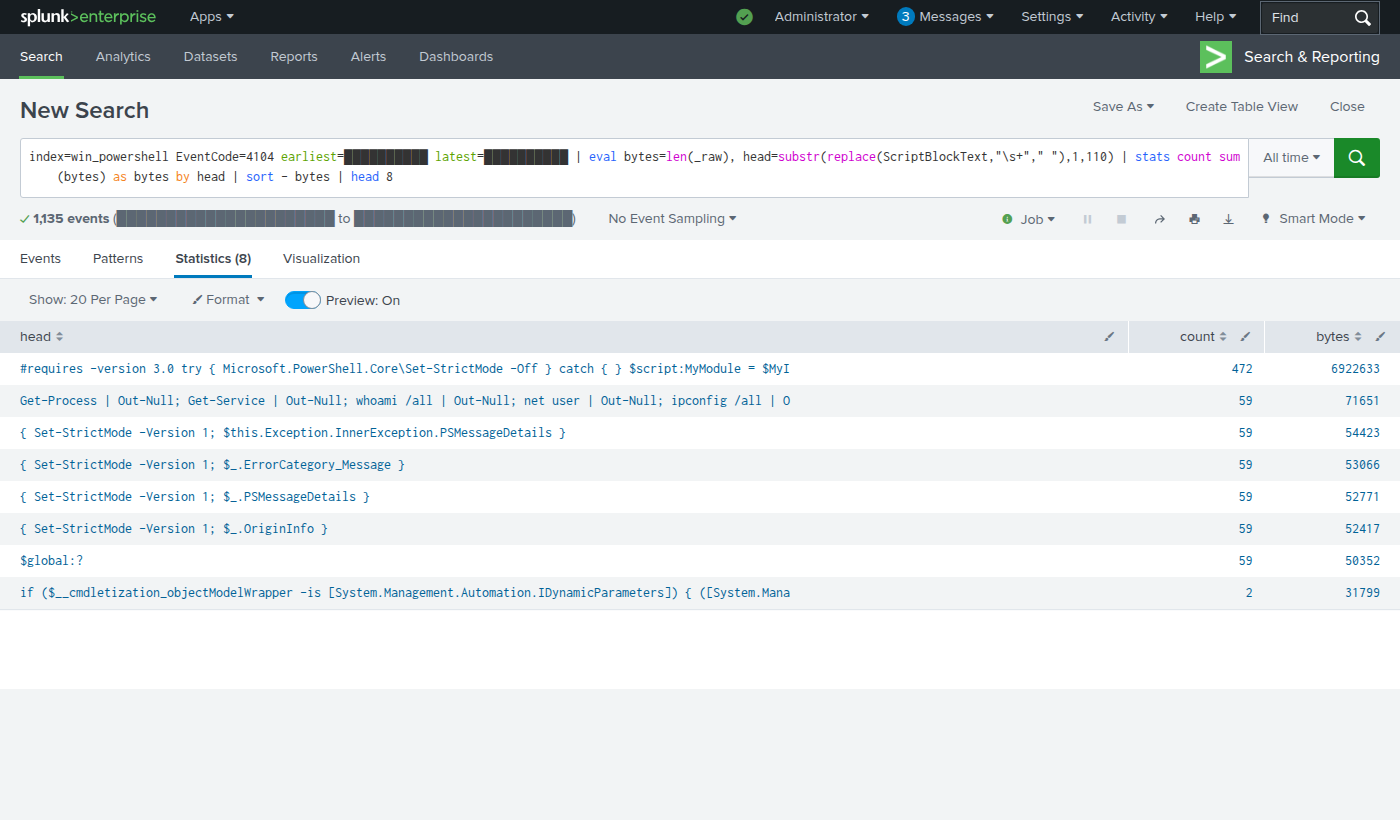
The top result wasn’t my command at all. It was a block that starts with #requires -version 3.0 and is full of variables named $__cmdletization_.... That’s code PowerShell generates for itself.
Here’s what’s going on. Some PowerShell commands, like Resolve-DnsName (which my workload uses) or Get-NetAdapter, aren’t normal compiled cmdlets. They’re defined in XML files (CDXML) that wrap Windows management (CIM) classes. The first time one of them is used in a new PowerShell process, PowerShell writes a proxy module on the fly to make it callable, and runs it. With Script Block Logging on, every line of that generated proxy gets logged, split across several events because it’s too big for one. My workload starts a fresh PowerShell process every minute, so this happened every minute.
In numbers: the command my workload actually ran was about 70 KB of script block logs over the hour. The generated proxy code around it was 10.8 MB. About 150 times bigger than the thing I actually care about.
Deciding What to Cut
It’s tempting to look at that and just turn Script Block Logging off. That would be the wrong call. 4104 is one of the most valuable Windows events there is: it records the code PowerShell actually runs after it’s been decoded, so an attacker who Base64-encodes a command or builds it out of string fragments still shows up in plain text. Post 4 depends on it.
So instead of asking “which source can I drop?”, I asked “which events inside each source carry no security value?” I ended up with three filters, and each one had to pass the same test: could an attacker hide inside this filter?
| Filter | What it drops | Why it’s safe | How it’s scoped |
|---|---|---|---|
| F1 | 4104 events containing PowerShell’s generated CDXML proxy code | It’s identical boilerplate every time. The command that called the cmdlet is a separate 4104 event and is kept. | Only EventID 4104, only blocks containing the __cmdletization_ / generated-module markers |
| F2 | Process-creation events (Sysmon 1 and Security 4688) for the forwarder’s own helper processes | It’s the monitoring tool watching itself run btool over and over |
Matched on the account (NT SERVICE\SplunkForwarder), not the install path |
| F3 | PowerShell host lifecycle events 40961, 40962, 53504 | “Console started” and “IPC listener started” add nothing that Sysmon’s process creation doesn’t already have | EventID only |
The scoping column is the part I spent the most time on.
For F2, the obvious filter is “drop anything running out of C:\Program Files\SplunkUniversalForwarder\.” But paths are easy to fake. An attacker with admin rights could drop a tool into that folder and it would vanish from my logs. Matching on the forwarder’s virtual account instead means a process only disappears if Windows itself says it’s running as NT SERVICE\SplunkForwarder, and that account can’t be logged into.
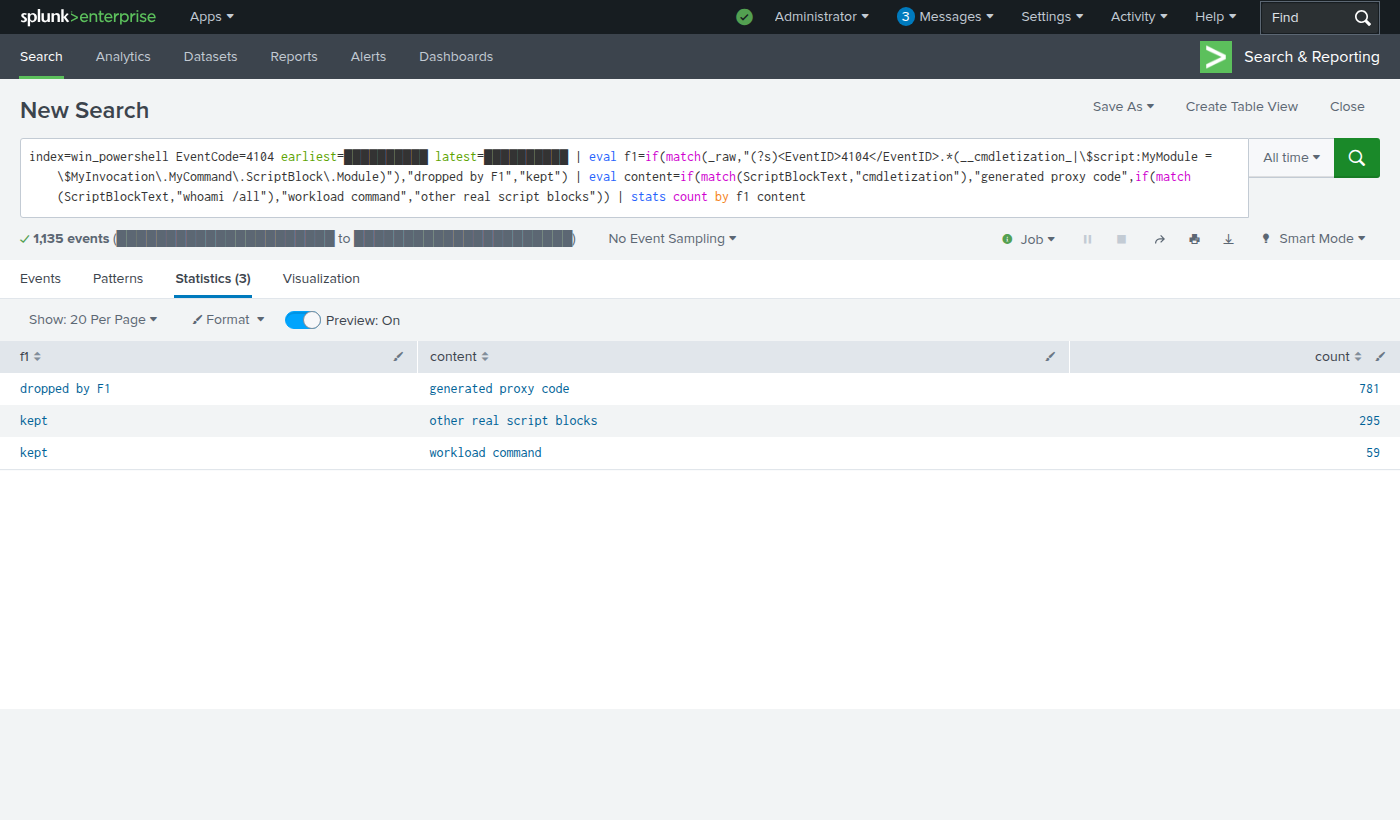
F1 is the one I’d flag to a client as a real tradeoff. The filter matches on text inside the script block, and in theory an attacker who knew about it could paste the marker string into their own script to get it dropped. Two things make me comfortable with it anyway: the attacker’s script still has to be launched, and that launch shows up in Sysmon and 4688 process-creation events, which F1 doesn’t touch. And I tested it: every dropped event in the baseline was generated proxy code, and every real command was kept.
One thing I deliberately didn’t cut: Security 4688 and Sysmon 1 both record process creation, so they’re partly duplicates. Sysmon’s version is better (hashes, parent command line, process GUIDs), so it’s tempting to drop 4688. I kept it. Stopping or tampering with Sysmon is a real attacker technique (ATT&CK T1562.001), and if that happens, 4688 is what’s left.
But I want to be straight about the cost: after filtering, 4688 is 26% of everything that’s left, the single biggest remaining line item. That’s not cheap. On a client with a tight license, this is the next conversation, and there’s a real alternative: drop 4688 and add an alert that fires when a host’s Sysmon data goes quiet. That trades a continuous backup for a tripwire. I’d keep 4688 on high-value servers like domain controllers and consider the tripwire approach for the rest of the fleet.
The Filters
Here’s what went into the deployment server’s inputs.conf. With renderXml = true, Windows inputs filter with $XmlRegex, which runs against the raw XML on the forwarder, before the data is sent. That’s the part that matters for the license: filtered events never leave the endpoint, so they’re never counted.
1
2
3
4
5
6
7
8
9
10
11
12
13
14
15
16
17
18
19
20
21
[WinEventLog://Microsoft-Windows-PowerShell/Operational]
index = win_powershell
renderXml = true
sourcetype = XmlWinEventLog
# F1: PowerShell's generated CDXML proxy modules
blacklist1 = $XmlRegex="(?s)<EventID>4104</EventID>.*(__cmdletization_|\$script:MyModule = \$MyInvocation\.MyCommand\.ScriptBlock\.Module)"
# F3: host/IPC lifecycle chatter
blacklist2 = $XmlRegex="<EventID>(40961|40962|53504)</EventID>"

[WinEventLog://Microsoft-Windows-Sysmon/Operational]
index = win_sysmon
renderXml = true
sourcetype = XmlWinEventLog
# F2: the forwarder's own processes, matched by account
blacklist1 = $XmlRegex="(?s)<EventID>1</EventID>.*<Data Name='User'>NT SERVICE\\SplunkForwarder</Data>"

[WinEventLog://Security]
index = win_security
renderXml = true
sourcetype = XmlWinEventLog
blacklist1 = $XmlRegex="(?s)<EventID>4688</EventID>.*<Data Name='SubjectUserName'>SplunkForwarder</Data><Data Name='SubjectDomainName'>NT SERVICE</Data>"
Before pushing it, I tested each regex against the baseline data already sitting in Splunk using match(_raw, ...). That predicted the savings before touching a single forwarder: 85.7%. Then I pushed it out through the deployment server, a one-file change, and the forwarder picked it up on its next check-in.
The Result
Same workload, same length of time:
| Index | Baseline (MB/hr) | Filtered (MB/hr) | Change |
|---|---|---|---|
win_powershell |
11.02 | 0.73 | -93% |
win_sysmon |
3.10 | 1.02 | -67% |
win_security |
1.11 | 0.67 | -40% |
win_system |
0.02 | 0.03 | noise |
| Total | 15.26 | 2.45 | -84% |
The Sysmon drop is entirely F2: its process-creation events for NT SERVICE\SplunkForwarder went from 360 in the hour to 0, while every other account’s count stayed flat (SYSTEM went from 308 to 322).
One thing I couldn’t explain: for Sysmon, the license log metered about twice as many bytes as the events themselves add up to (3.10 MB vs. 1.62 MB by len(_raw)), while PowerShell and Security matched within a few percent. I ruled out index-time vs. event-time differences, extra sources, and multi-byte characters. I used the license numbers throughout, because that’s what a client actually pays for, and the overall cut is about the same either way.
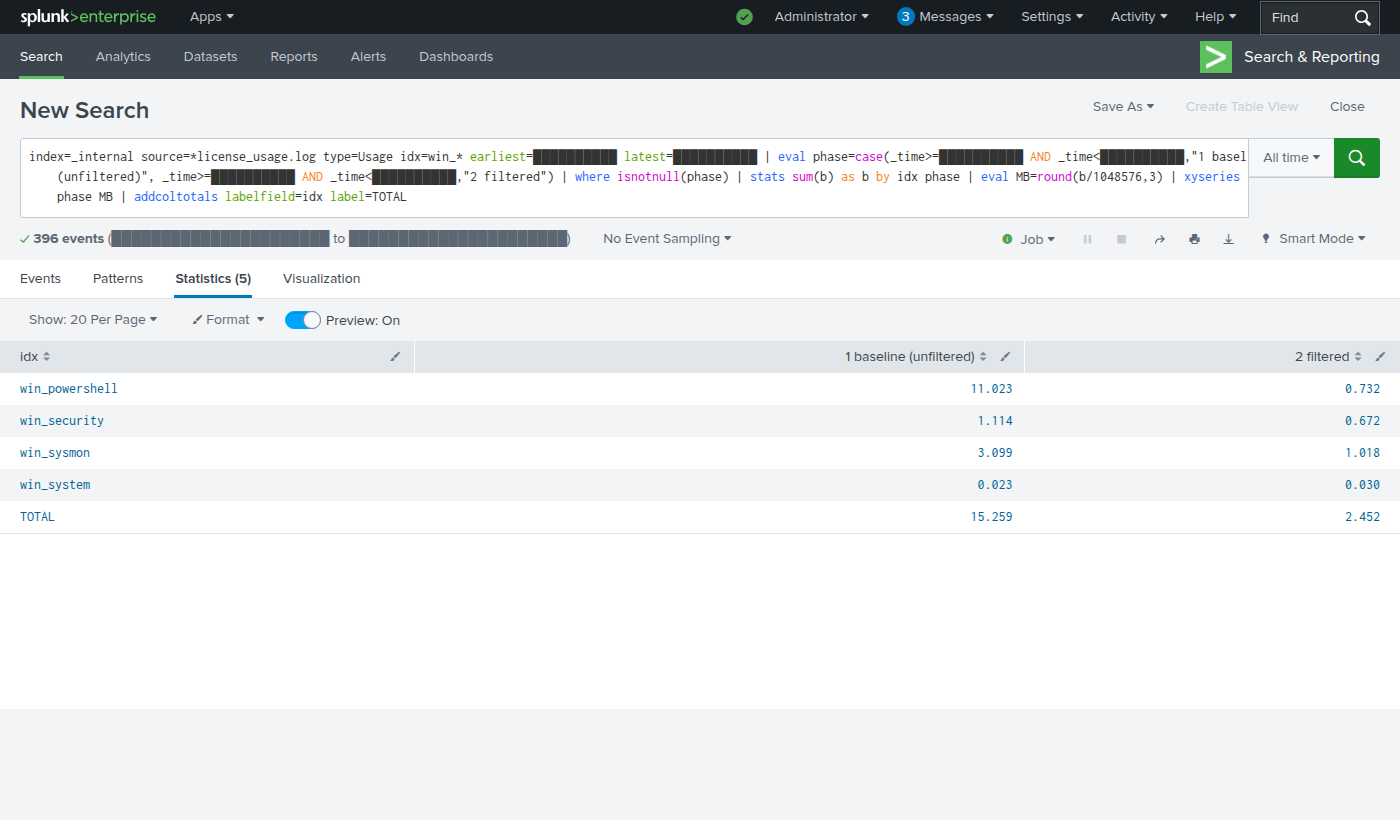
Daily ingest dropped from 366 MB to 59 MB per host, a 84% cut. The prediction from testing the regexes against old data was 85.7%, so the measurement matched.
To put that in client terms: on a 500-server environment with this same workload, that’s the difference between about 180 GB and 29 GB a day. Splunk licenses are sold in daily-volume tiers, so a cut that size can move a client down a tier, or free up room to add a data source they couldn’t afford before.
A caveat I want to be honest about: this is one server running a synthetic workload. A real domain controller or a busy developer workstation would have a completely different mix, and the percentages would change. What carries over is the method: measure by source, then by Event ID, find out why the top item is big, and only cut what you can prove has no security value.
Did Detection Survive?
A cut like this only counts if it didn’t cost anything. In post 4 I ran Atomic Red Team attacks against this server with these filters in place. All eight detections that should have fired, did, with the filters on. The filters only ever dropped generated boilerplate and the forwarder’s own noise, never a technique. Full results in that post.
What I’d Tell a Client
- Measure before you cut.
license_usage.logtells you which index costs the most.len(_raw)by Event ID tells you why. - The expensive thing is often not what you’d guess. I’d have bet on Sysmon. It was PowerShell logging its own generated code.
- Filter events, not sources. Turning off Script Block Logging would have saved the most, and blinded the SOC to the single best source for catching malicious PowerShell.
- Scope every filter so it can’t be abused. Match on what an attacker can’t control (an account Windows assigns) rather than what they can (a file path).
- Filter at the forwarder. Dropping data after it reaches the indexer still counts against the license.