Onboarding a Windows Client to Splunk: Deployment Server, Universal Forwarder, and the Gotchas Nobody Mentions
Standing up a fresh Splunk instance for a "client," onboarding a Windows Server with a Universal Forwarder managed by a deployment server, and the four things that silently broke along the way.
At my SOC job I lived on the receiving end of Splunk. Alerts showed up, I triaged them, and I escalated the ones that mattered. What I never touched was the other end: how the data got there in the first place. Somebody decided which Windows logs to collect, installed the forwarders, and wrote the configs that turned raw events into fields I could search on. When that part is done badly, the analyst is the one who pays for it with an alert that fires on nothing, or worse, an alert that never fires at all.
So this post is me building that other end from scratch, the way an MDR provider would for a new client: a dedicated Splunk instance, one Windows server to onboard, and a deployment server so the forwarder’s configuration lives centrally instead of being hand-edited on every endpoint.
Where this fits. First post in a four-part Splunk series. This one gets the data in. The next one asks which of that data is actually worth paying for, then I write detections against it in both SPL and KQL, and finally I attack the box with Atomic Red Team to see what the detections actually catch.
The Design
Everything runs as KVM guests on one Linux host, on a dedicated NAT network (bd-client, 10.50.0.0/24) so this “client” doesn’t share anything with my other labs.
flowchart LR
  subgraph client["bd-client network — 10.50.0.0/24"]
    win["bd-win01 (10.50.0.20)<br/>Windows Server 2022<br/>Universal Forwarder + Sysmon"]
    splunk["bd-splunk (10.50.0.10)<br/>Splunk Enterprise 9.4.2<br/>indexer + search head + deployment server"]
  end
  win -- "phones home on 8089<br/>(gets its apps)" --> splunk
  win -- "sends events on 9997<br/>(with indexer ACK)" --> splunk
A few terms, since I’m not assuming you know Splunk’s architecture:
- Universal Forwarder (UF) is a small agent that sits on the endpoint, reads logs, and ships them to Splunk. It doesn’t search or parse much. It just collects and sends.
- Indexer is where the data lands and gets stored in indexes, which are basically separate buckets with their own retention and access rules.
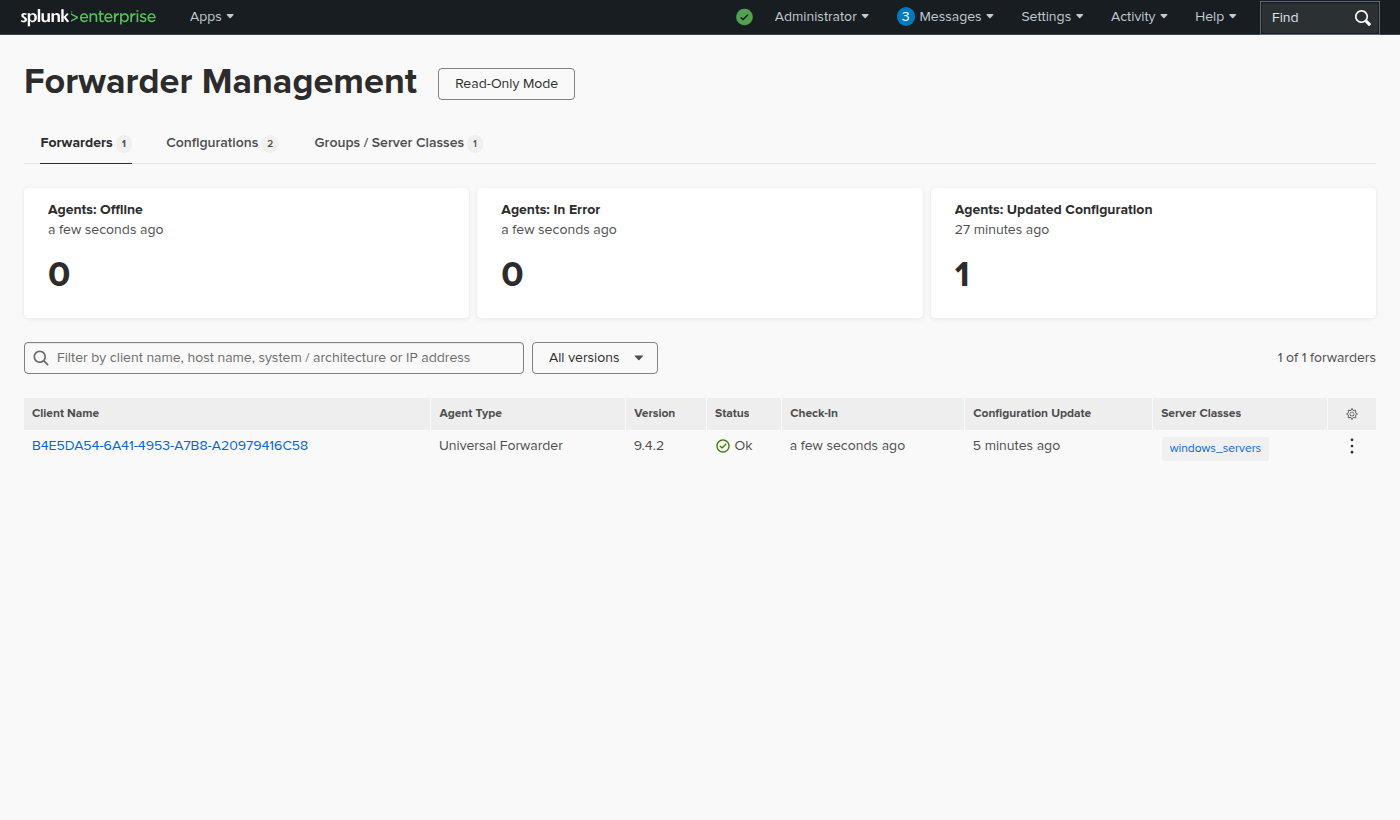
- Deployment server is a Splunk role that hands configuration “apps” out to forwarders. The forwarder phones home every minute, the deployment server checks which server class it belongs to, and it pushes whatever apps that class is supposed to have. Change the config once on the server and every forwarder picks it up.
In a real client environment these would be separate boxes. For one Windows host, one Splunk instance doing all three jobs is fine, and the configs are the same either way.
Why a New Splunk Instance
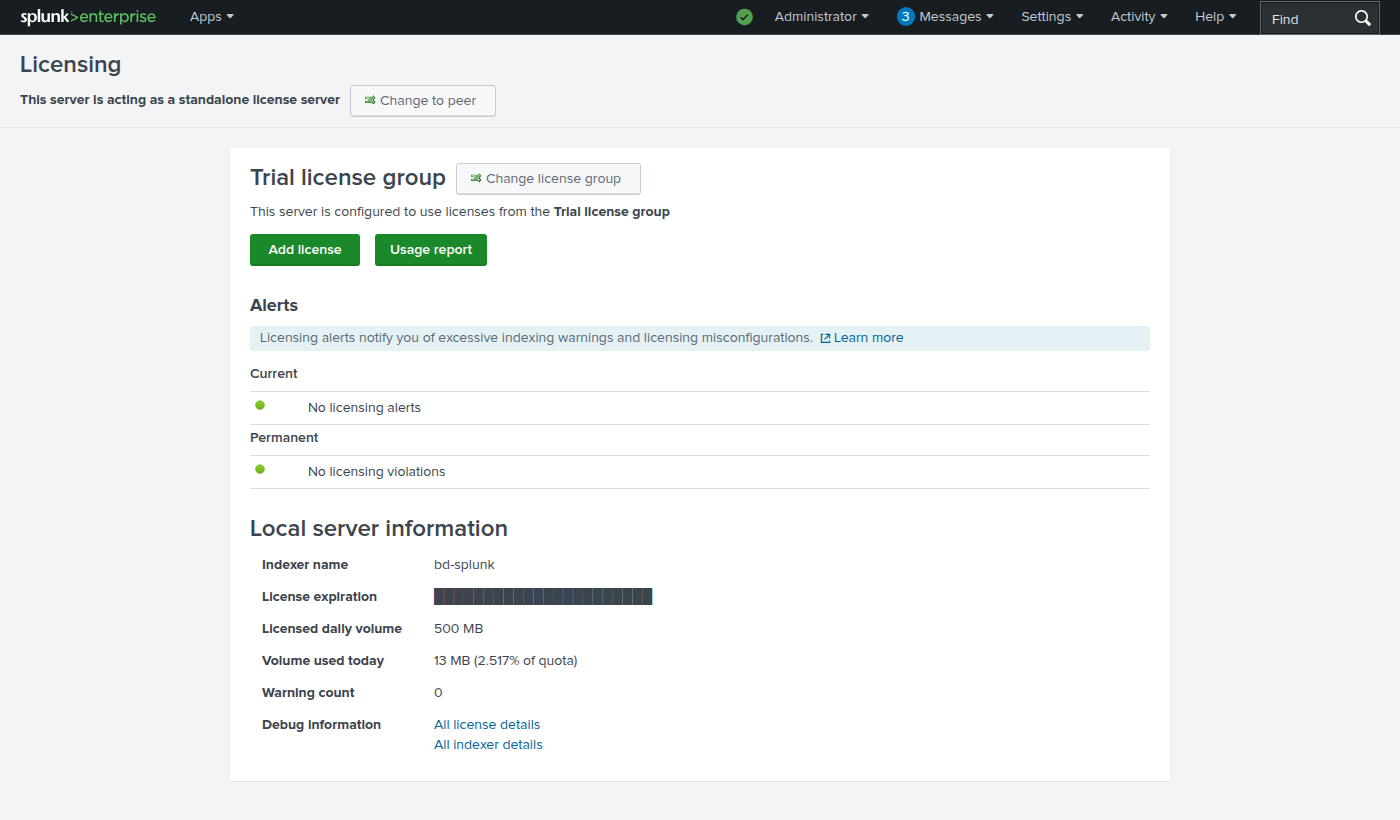
My NERC CIP lab already has a Splunk VM. When I booted it, the 60-day Enterprise trial I started back in June had expired, and it had quietly dropped to Splunk Free. Free has no alerting and no deployment server, which are two of the three things I needed.
Instead of fighting that, I built a fresh VM. That also happens to be the more realistic setup: an MDR provider runs a separate Splunk instance per client, not one big shared one. The install itself was the boring part: the .deb, a user-seed.conf to set the admin password without a prompt, splunk enable listen 9997 to receive data, and boot-start.
One Index per Data Source
Before collecting anything, I created four indexes, one per Windows source:
1
2
3
4
5
6
7
8
9
10
# bd_client_indexes/default/indexes.conf
[win_security]
homePath   = $SPLUNK_DB/win_security/db
coldPath   = $SPLUNK_DB/win_security/colddb
thawedPath = $SPLUNK_DB/win_security/thaweddb
frozenTimePeriodInSecs = 7776000    # 90 days

[win_sysmon]       # same pattern, 90 days
[win_powershell]   # same pattern, 90 days
[win_system]       # same pattern, 30 days
Throwing everything into one windows index would have been easier. I split them for two reasons that matter to a client:
- Retention and access. System logs are useful for troubleshooting but rarely for an investigation 60 days later, so they get 30 days instead of 90.
- License visibility. Splunk bills on how much data you ingest per day, and its license log breaks usage down by index. One index per source means I can answer “what does Sysmon cost us?” directly, which is exactly what the next post is about.
The Deployment Server Apps
The forwarder gets two apps from the deployment server. Neither one is hand-edited on the endpoint.
bd_all_outputs tells every forwarder where to send data:
1
2
3
4
5
6
[tcpout]
defaultGroup = bd_indexers

[tcpout:bd_indexers]
server = 10.50.0.10:9997
useACK = true
useACK makes the indexer confirm it actually wrote each block of data before the forwarder forgets it. Without it, events in flight during an indexer restart can just vanish, and for security data “we might have dropped some logs” isn’t an acceptable answer.
bd_win_inputs says what to collect:
1
2
3
4
5
6
7
8
9
10
11
12
13
14
15
16
17
18
19
[WinEventLog://Security]
disabled = 0
index = win_security
renderXml = true
sourcetype = XmlWinEventLog
start_from = oldest
current_only = 0

[WinEventLog://System]
index = win_system
...

[WinEventLog://Microsoft-Windows-Sysmon/Operational]
index = win_sysmon
...

[WinEventLog://Microsoft-Windows-PowerShell/Operational]
index = win_powershell
...
And the server class ties them together: any client whose hostname matches bd-win* gets both apps.
1
2
3
4
5
6
# serverclass.conf
[serverClass:windows_servers]
whitelist.0 = bd-win*

[serverClass:windows_servers:app:bd_all_outputs]
[serverClass:windows_servers:app:bd_win_inputs]
Onboarding the Endpoint with PowerShell
For the Windows side I wrote one PowerShell script, Install-BDForwarder.ps1, so onboarding is repeatable instead of a checklist someone clicks through. It does three things.
1. Turns on the logging worth collecting. A default Windows install doesn’t log most of what a SOC needs. The script enables:
- PowerShell Script Block Logging (Event ID 4104), which records the actual code PowerShell runs, even after it’s been decoded from Base64.
- Process creation auditing with command lines (Event ID 4688). Without the extra registry value you get the process name but not its arguments, which is like knowing someone ran
powershell.exebut not what they told it to do. - Logon and account management auditing, for failed logons (4625) and new accounts (4720).
1
2
3
4
5
6
7
$sbl = 'HKLM:\SOFTWARE\Policies\Microsoft\Windows\PowerShell\ScriptBlockLogging'
New-Item -Path $sbl -Force | Out-Null
Set-ItemProperty -Path $sbl -Name EnableScriptBlockLogging -Value 1 -Type DWord

auditpol /set /subcategory:"Process Creation" /success:enable /failure:enable
Set-ItemProperty -Path 'HKLM:\...\Policies\System\Audit' `
  -Name ProcessCreationIncludeCmdLine_Enabled -Value 1 -Type DWord
In a real client environment this belongs in Group Policy, not a script. For one server the script does the same thing.
2. Installs Sysmon with the SwiftOnSecurity community config. Sysmon adds process, network, and file events with far more detail than the built-in logs, like the parent process and hashes for every process that starts.
3. Installs the Universal Forwarder silently and points it at the deployment server. That’s the only thing the endpoint knows about Splunk:
1
2
3
msiexec /i splunkforwarder-9.4.2-...-windows-x64.msi `
  DEPLOYMENT_SERVER=10.50.0.10:8089 AGREETOLICENSE=Yes `
  SPLUNKUSERNAME=admin SPLUNKPASSWORD=<random> LAUNCHSPLUNK=1 /quiet
Everything about what it collects comes from the deployment server a minute later.
I ran it remotely over WinRM from my Linux host, and the output is short on purpose:
1
2
3
4
5
6
7
8
9
10
11
12
13
14
15
[+] Enabling PowerShell Script Block Logging (Event ID 4104)
[+] Enabling process creation auditing with command lines (Event ID 4688)
[+] Enabling logon and account-management auditing
[+] Installing Sysmon with the SwiftOnSecurity config
[+] Downloading splunkforwarder-9.4.2-e9664af3d956-windows-x64.msi
[+] Installing forwarder (deployment server: 10.50.0.10:8089)
[+] Verification

Name             Status StartType
----             ------ ---------
SplunkForwarder Running Automatic
Sysmon64        Running Automatic

[target-broker:deploymentServer]
targetUri = 10.50.0.10:8089
A minute after the script finished, BD-WIN01 showed up in Forwarder Management with both apps deployed.
That’s where I thought I was done. I wasn’t.
Gotcha 1: The Sourcetype Wasn’t What I Expected
Data was arriving, but none of my fields were. I’d written my own field extractions for the XML events (more on that below) under a [XmlWinEventLog] stanza, and they matched nothing.
The reason: with renderXml = true and no Splunk Add-on for Windows installed, the forwarder labels each event with a sourcetype that includes the channel name, like XmlWinEventLog:Security or XmlWinEventLog:System. My props stanza was looking for the plain name.
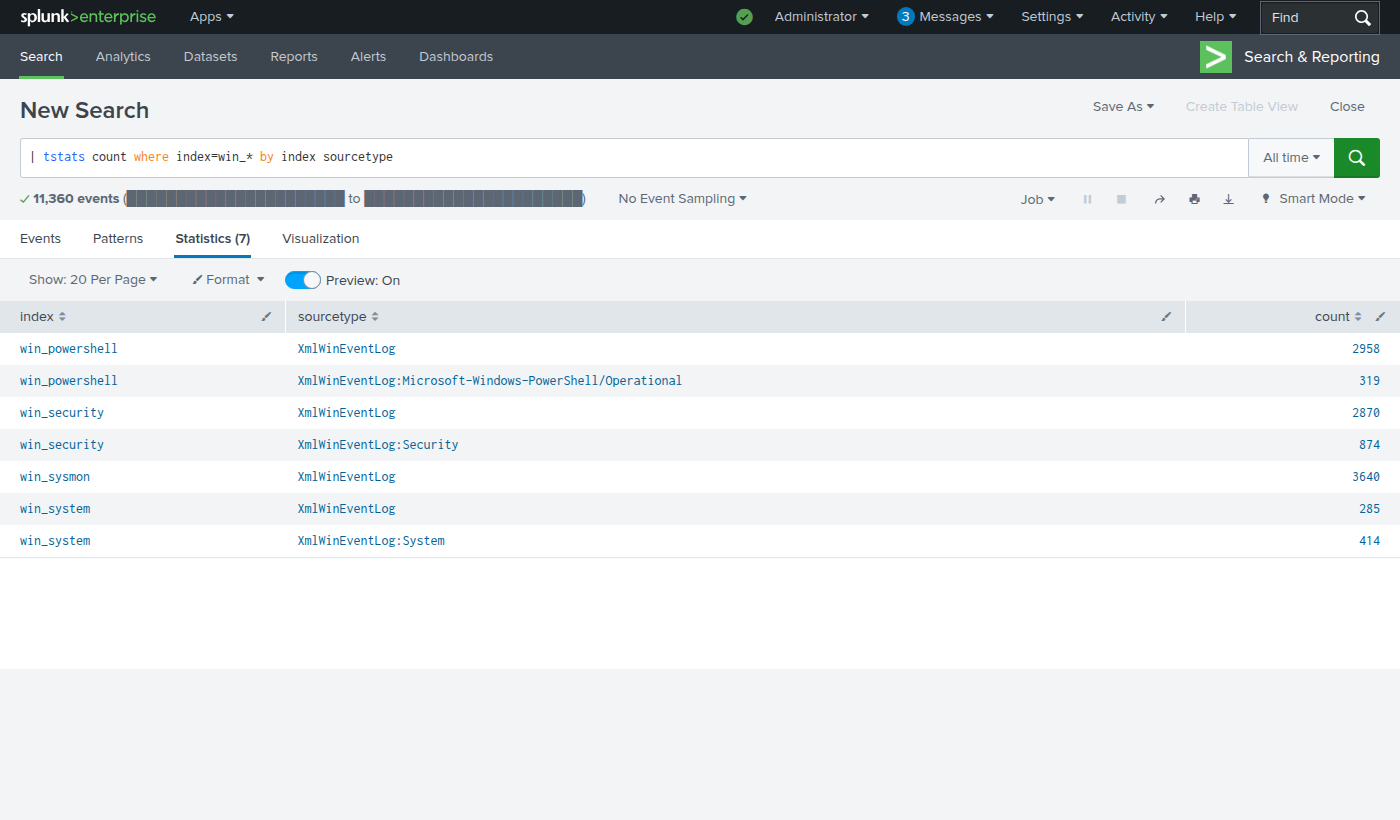
The fix was one line in every input, sourcetype = XmlWinEventLog, which is exactly what the official Windows add-on does. The channel still lives in the source field, so nothing is lost. Because the inputs come from the deployment server, I changed the file once, ran splunk reload deploy-server, and the forwarder picked it up on its next check-in.
Gotcha 2: Sysmon Was Missing and Nothing Complained
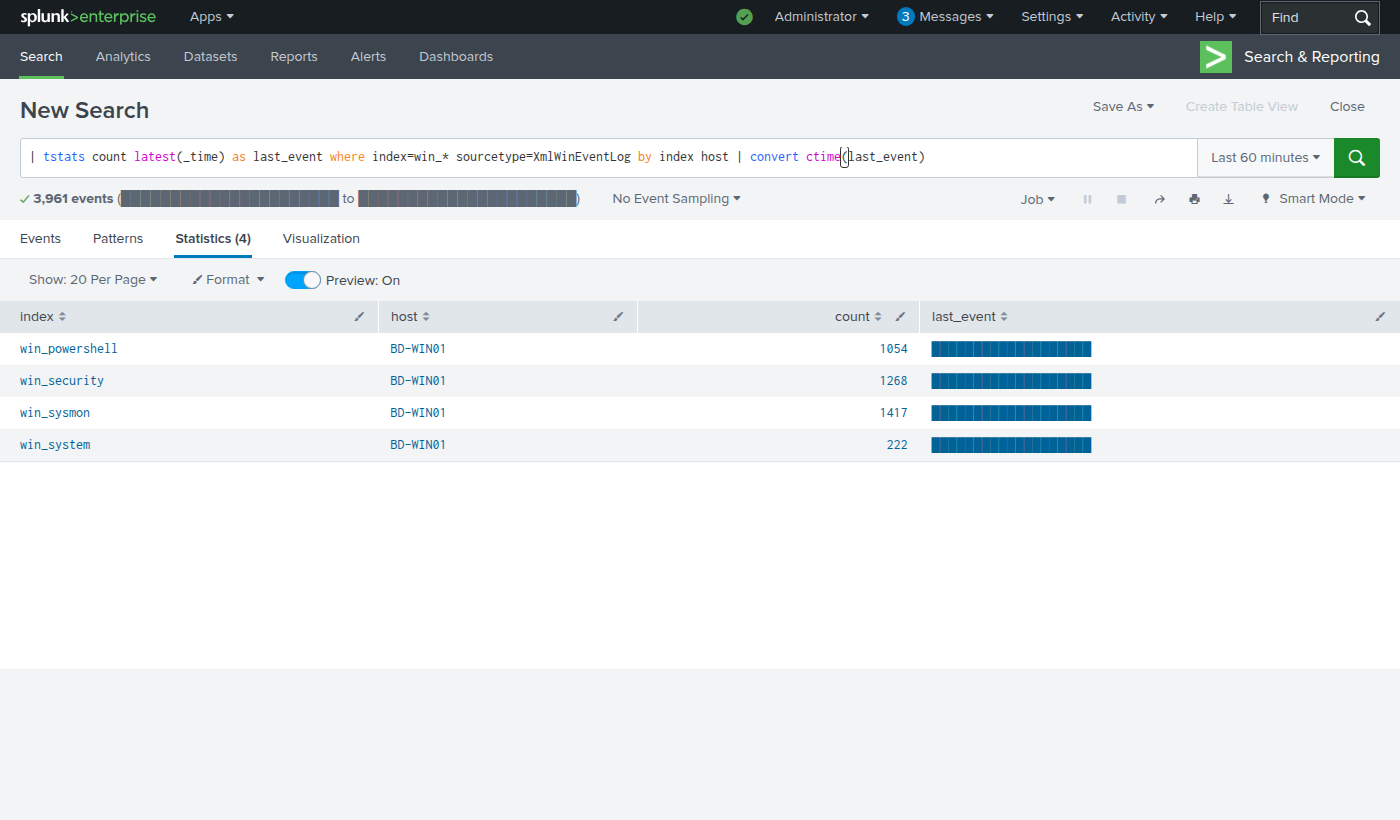
Three of my four indexes were filling up. win_sysmon stayed at zero. Sysmon was running and its log had hundreds of events in it. No error showed up anywhere I was looking.
The forwarder’s own log on the endpoint (splunkd.log) had the answer:
1
2
ERROR ExecProcessor ... splunk-winevtlog - WinEventLogChannel::subscribeToEvtChannel:
Could not subscribe to Windows Event Log channel 'Microsoft-Windows-Sysmon/Operational'
Since version 9.1 the Universal Forwarder doesn’t run as SYSTEM anymore. It runs as a low-privilege virtual account, NT SERVICE\SplunkForwarder. That’s a good security change, since a forwarder running as SYSTEM is a juicy target, but it means the forwarder can only read what that account is allowed to read.
The installer grants it a special privilege to read the Security log, which is why Security worked. The Sysmon channel has its own access list, though, and it only allows three groups:
1
channelAccess: O:BAG:SYD:(A;;0xf0007;;;SY)(A;;0x7;;;BA)(A;;0x1;;;BO)(A;;0x1;;;SO)(A;;0x1;;;S-1-5-32-573)
SY is SYSTEM, BA is Administrators, and S-1-5-32-573 is the built-in Event Log Readers group, which was empty.
The tempting fix is to set the forwarder service back to run as SYSTEM. The right fix is to give it only what it needs:
1
2
net localgroup 'Event Log Readers' 'NT SERVICE\SplunkForwarder' /add
Restart-Service SplunkForwarder
Sysmon data started flowing within a minute. I added this step to the onboarding script, so the next server gets it automatically.
The scary part is how quiet this failure is. From the Splunk side, nothing looks broken; you just have an index with no data in it. If I hadn’t been checking each index by name, I could have written Sysmon detections and trusted them for months while they searched an empty bucket. Now “does every index I expect have data from every host I expect” is the first check I’d run on any client.
Gotcha 3: Field Extractions Nobody Else Could See
I didn’t install the Splunk Add-on for Windows (Splunkbase needs a login, and I wanted to understand what it does anyway). So I wrote the key field extractions myself. Windows XML events store their details as <Data Name='X'>value</Data> pairs, so one regex turns every one of them into a field:
1
2
3
4
5
6
7
8
9
10
11
12
13
14
15
# props.conf
[XmlWinEventLog]
KV_MODE = none
REPORT-xml_system = bd_xml_eventid, bd_xml_computer, bd_xml_channel
REPORT-xml_data   = bd_xml_eventdata

# transforms.conf
[bd_xml_eventdata]
REGEX  = <Data Name='([^']+)'>([^<]*)</Data>
FORMAT = $1::$2
MV_ADD = true

[bd_xml_eventid]
REGEX  = <EventID[^>]*>(\d+)</EventID>
FORMAT = EventCode::$1
It worked when I searched from inside that app and did nothing from the regular Search app. Knowledge objects in a custom app are private to that app by default. One file fixes it:
1
2
3
# metadata/default.meta
[]
export = system
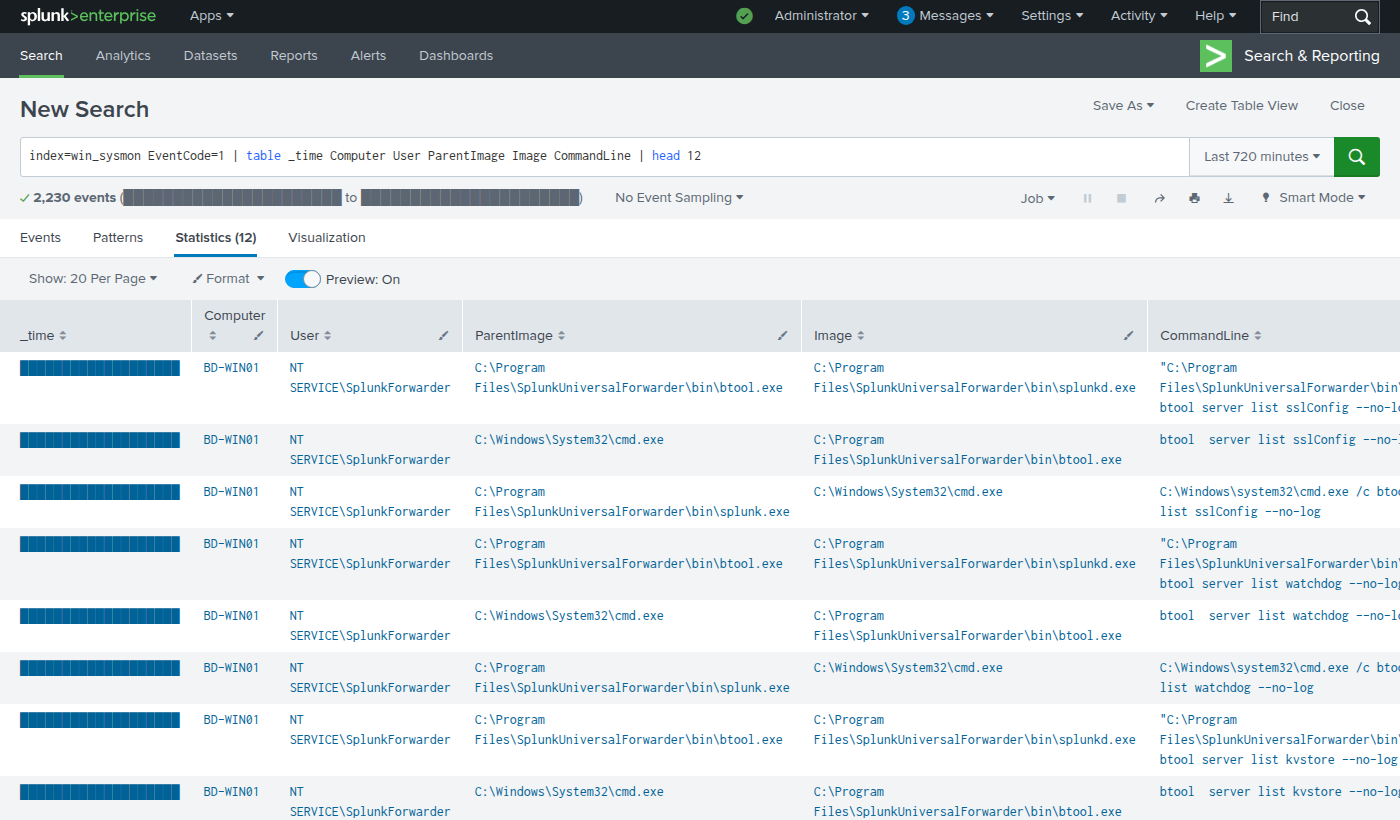
After that, Image, CommandLine, ParentImage, ScriptBlockText, TargetUserName and the rest all showed up as normal fields everywhere.
Gotcha 4: The Forwarder Logs Itself
Look at that last screenshot again. The process-creation events weren’t from anything interesting. They were the forwarder itself: splunk.exe spawning cmd.exe spawning btool to check its own config, over and over, all as NT SERVICE\SplunkForwarder. That’s the monitoring tool generating noise about itself, which is the same lesson I learned with Security Onion watching its own management traffic. It’s not a problem yet, but it goes on the list for the next post, where every event has a price.
Where Things Stand
- A dedicated Splunk instance for the “client,” with one index per Windows data source.
- One Windows server onboarded by a script, with the logging a SOC actually needs turned on.
- A deployment server that owns the forwarder’s configuration, so changing what we collect is a server-side edit, not a login to every endpoint.
- Four fixes that each would have left a quiet gap in coverage.
Next post: now that the data is flowing, how much of it is worth paying for?