Network Security Monitoring with Security Onion on Proxmox
Deploying Security Onion on Proxmox and mirroring DMZ and Trust traffic to it with Open vSwitch — building a network sensor behind my Palo Alto firewall.
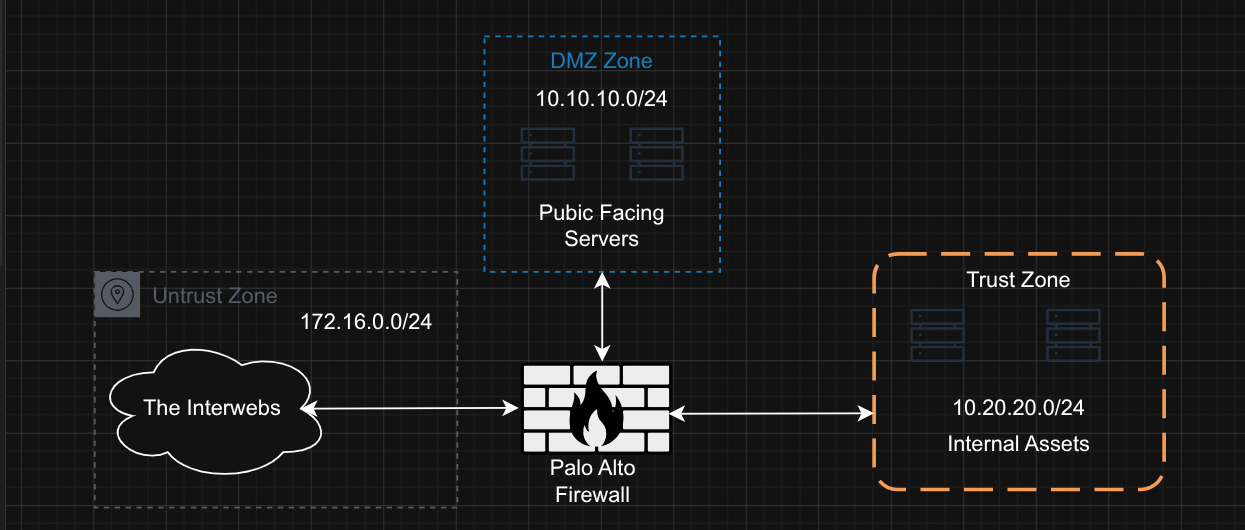
Security Onion is a free, open-source Linux platform tailored for threat hunting, enterprise security monitoring, and log management. It functions as an all-in-one detection engine—combining signature-based tools like Suricata and Zeek with the Elastic Stack. So my first step was to see where I wanted this detection engine to sit in my network. This post expands upon my previous post where I set up three zones revolving around a Palo Alto firewall.
So during my research I saw that there were two distinct ways data can feed into Security Onion, and it’s worth separating them up front because they carry very different cost and effort profiles.
Path 1 — Firewall log forwarding. The Palo Alto firewall simply ships its syslog to Security Onion over the network, the same way any device sends logs to a central collector. The only requirement is that the two systems can reach each other. There’s no special plumbing — it’s a configuration change, not an architecture change. In business terms, this is the fast, low-risk win: it gives me a searchable record of what the firewall is already seeing, with almost no added complexity.
Path 2 — Full network traffic inspection. This is the deeper half, and where Security Onion earns its network security monitoring name. Instead of trusting summaries from other devices, the platform inspects a copy of the actual traffic crossing the network — the equivalent of reviewing the raw footage rather than the security guard’s written report. That depth is the whole point, but it doesn’t come for free: because everything here runs as virtual machines on a single host, I have to deliberately route a mirrored copy of network traffic to Security Onion. That’s real design work, and it’s the part most people underestimate but one I was ready to do.
To support both paths, the Security Onion VM needs two network connections, each with a clear job:
- A management connection that carries an address on the network, receives the firewall logs, and hosts the web console I actually log into. I placed this on my Trust zone (
10.20.20.0/24), where both I and the firewall can reach it. - A monitoring connection that has no address and stays invisible on the network. Its only role is to silently receive the mirrored traffic for inspection. Even before I send anything to it, the installer requires me to designate one — so planning for it now avoids rework later.
In my case I am going to monitor the DMZ network and the trusted network so I will need 2 monitoring connections this time.
The takeaway: log forwarding gives you visibility quickly and cheaply, while full traffic inspection gives you depth at the cost of upfront design. Both are worth having, but knowing which is which keeps the effort honest.
Proxmox Maxxing Time
With the two data paths sorted out in my head, the real work began on the Proxmox side — and this is the part I warned about earlier, where full traffic inspection stops being a configuration change and becomes a design decision.
Here’s the problem in plain terms. On a physical network, if you want a sensor to see traffic, you plug it into a switch port configured as a SPAN (or mirror) port, and the switch dutifully copies every frame to it. But my network isn’t physical — it’s a set of virtual machines hanging off virtual bridges inside Proxmox. And a standard Proxmox bridge is essentially a dumb switch: it moves traffic between the ports connected to it, but it has no concept of handing a copy to an observer. So out of the box, there’s no way to feed Security Onion the mirrored traffic it needs.
I had two ways to solve this, and I want to be honest about why I picked the one I did.
My first instinct was to mirror at the firewall. The Palo Alto is the chokepoint — every cross-zone packet already passes through it, so why not have it spit out a copy? It turns out PAN-OS can only mirror decrypted traffic out an interface, not a general copy of everything crossing it. That’s a narrow, license-gated feature meant for inspecting SSL after the firewall has already opened it up — not the clean full-traffic tap I was after. The Palo Alto documentation itself says the honest answer: if you want to span all traffic, do it at the switch. In a virtualized lab, the switch is Proxmox. So the mirroring belongs on the Proxmox side after all.
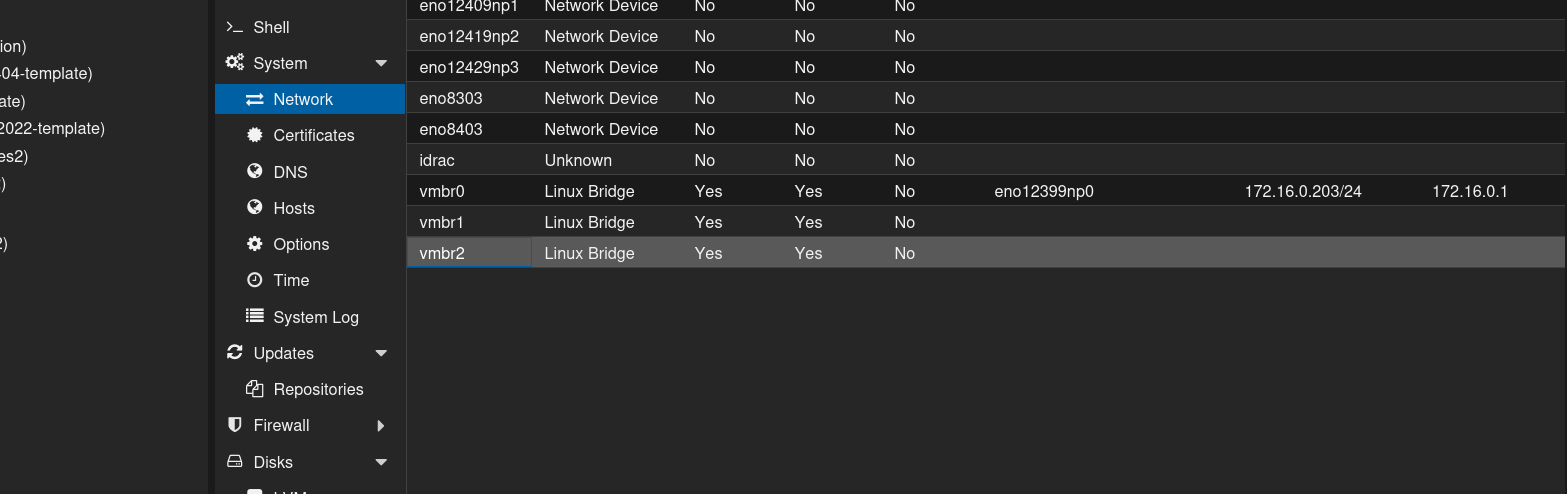
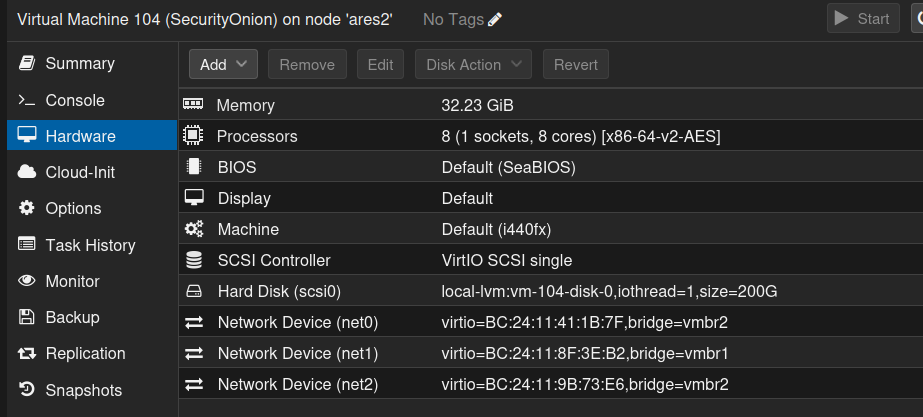
That left two Proxmox-side options: convert my bridges to Open vSwitch (OVS) and use its native mirroring, or leave them as plain Linux bridges and script the mirror with traffic-control rules. The scripted approach works, but it isn’t persistent — it has to be re-established after every reboot with a cron hook. OVS mirroring is declarative and survives reboots once it’s in the config. For something I want running 24/7 without babysitting, the persistent option was the obvious call. Below shows the vNICs before the conversion process.
Converting the bridges
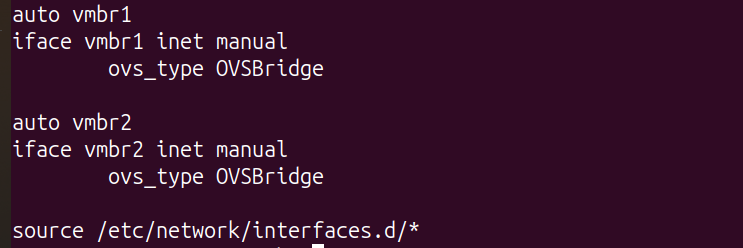
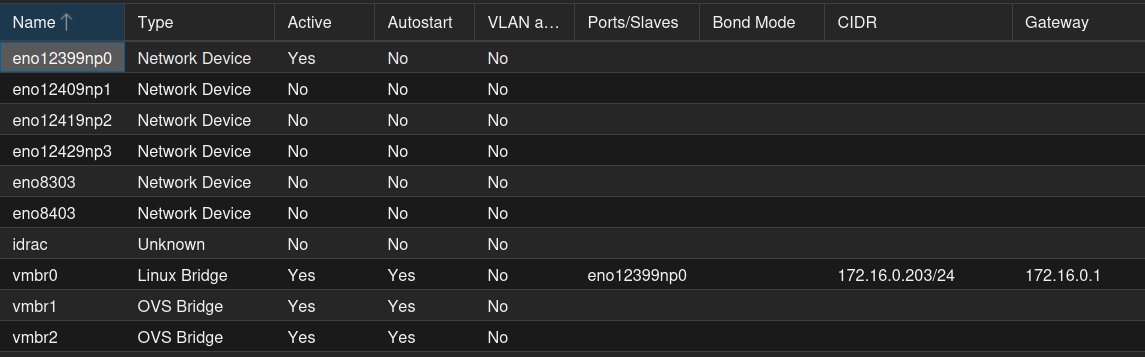
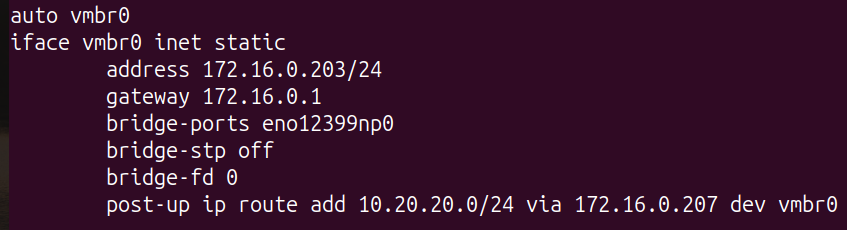
My zones map to three bridges: vmbr0 for Untrust (which also carries the host’s own management address), vmbr1 for the DMZ, and vmbr2 for the Trust network. Since I only want to monitor DMZ and Trust, those are the two I converted to OVS — vmbr0 stays a plain Linux bridge and I deliberately never touched it, because that bridge is how the host itself stays on the network. Converting the wrong bridge is how you knock your hypervisor offline. To change them it was a quick edit in the /etc/network/interfaces file on my proxmox host.
Both vmbr1 and vmbr2 were internal-only bridges (see above screenshot) — no physical uplink port, no IP address of their own. They existed purely to connect the firewall’s legs to the zone VMs. That meant there was nothing to migrate during the conversion: no uplink to carry over, no bridge address to preserve. The change came down to swapping a handful of Linux-bridge directives in the /etc/network/interfaces file on proxmox for their OVS equivalents, backing up the network config first, and rebooting the host to apply it cleanly.
The one real cost is downtime. Reconfiguring those bridges drops everything attached to them — the firewall and every DMZ and Trust VM blink out and come back. On a hypervisor that means scheduling it like a maintenance window rather than something you do casually in the middle of the day.
Wiring the VM
The Security Onion VM itself got three network connections, mapping directly to the two-path design:
- Management on the Trust network — this is the addressed connection that receives logs and serves the web console.
- DMZ monitor on the DMZ bridge — no address, promiscuous, exists only to receive mirrored DMZ traffic.
- Trust monitor on the Trust bridge — same idea, for Trust traffic.
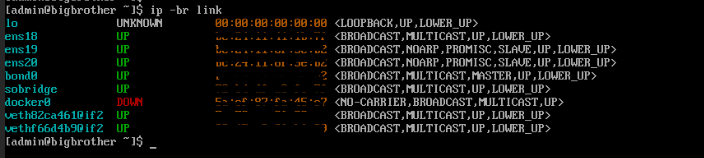
One detail surprised me during setup, and it’s worth flagging for anyone following along: when you designate two monitoring connections, Security Onion bonds them together into a single logical interface and points its detection engines at the bond. So my two zone mirrors don’t stay as two separate feeds inside the sensor — they merge into one monitoring pipe. That’s by design, not a mistake, and it actually simplifies the mental model: everything I mirror, from either zone, lands in the same place for inspection.
You can see below that the ens18 interface is the regular management interface and the ens19 (DMZ) and ens20 (Trust) interfaces are “slaves” in promiscuous (monitoring) mode.
Installing Security Onion
With the network plumbing ready, the install was the straightforward part — which, after the design work, was a relief.
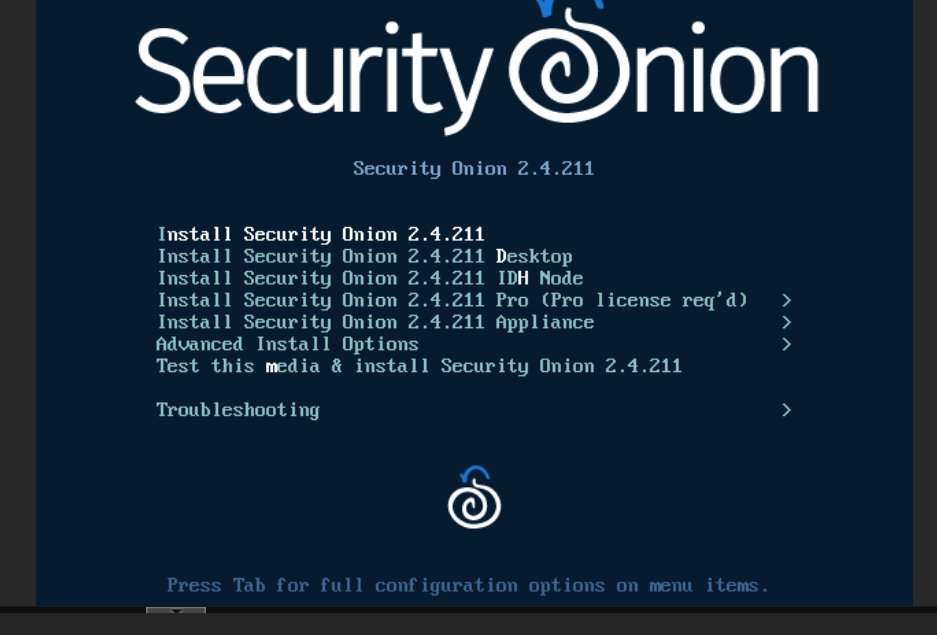
I booted the Security Onion 2.4 ISO, which lays down a hardened Oracle Linux base and then hands off to the setup wizard. I chose the Standalone deployment rather than the lighter evaluation mode, because I had the resources to spare and Standalone runs the real ingest pipeline — the full Elastic stack with proper log buffering — rather than the trimmed-down version. If I’m going to feed this thing a firehose of firewall logs later, I want the architecture that’s built to handle bursts.
The wizard walked through the essentials: pick the management connection and give it a static address on the Trust network, designate the two monitoring connections, set the console login, and define which network is allowed to reach the web interface.
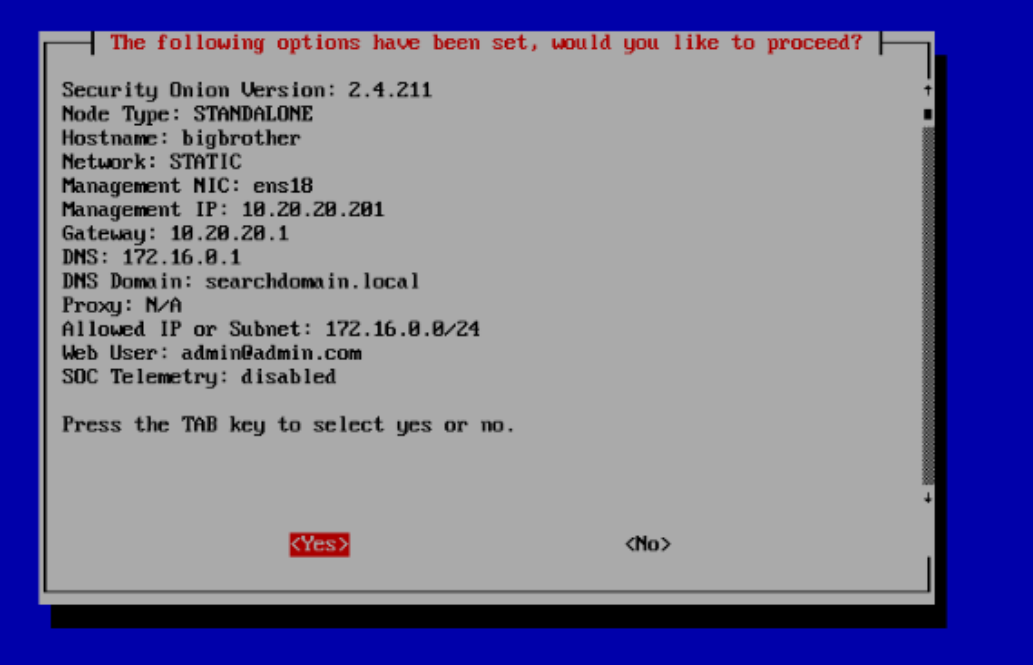
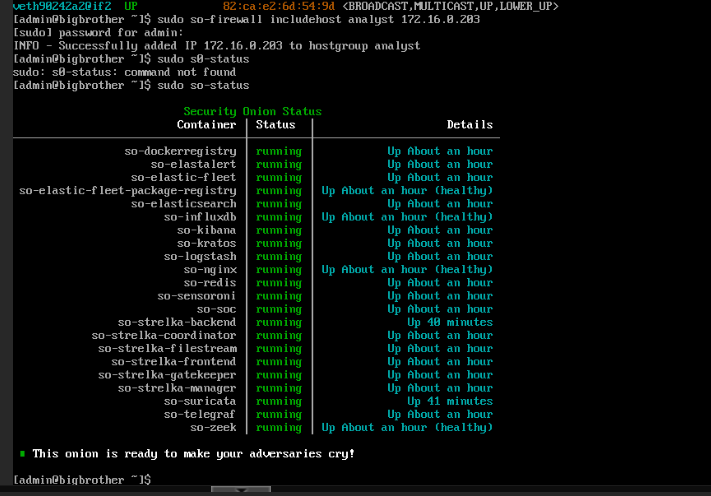
Then it went to work — pulling the entire detection stack as containers (Elasticsearch, Kibana, Zeek, Suricata, and the rest) and applying around a hundred configuration steps. The number I cared about at the end was the failure count, and it came back zero. Setup reported complete, with the address for the web console.
A note for anyone attempting this: the install genuinely depends on the box being able to reach the internet to pull those containers, which means name resolution and outbound routing through the firewall both have to be working before you start. My first attempt stalled because I’d pointed the sensor’s DNS at the firewall, which isn’t a resolver. Pointing it at a real DNS server fixed it. It’s a small thing that quietly wastes an hour if you get it wrong.
Reaching the Console — The Part That Isn’t Obvious
Here’s a lesson I didn’t fully appreciate until I hit it: installing the sensor is only half the job. Reaching it is its own design problem when it lives behind a firewall that segments your network.
The console runs on the Trust zone. But the machine I work from sits in a different zone, and the whole point of the Palo Alto is that it denies traffic between zones unless I explicitly allow it. So even though the sensor was up and healthy, my browser couldn’t touch it — by design. The firewall was doing exactly its job.
Getting in took two separate fixes, and it’s worth understanding why both were necessary, because they solve different problems:
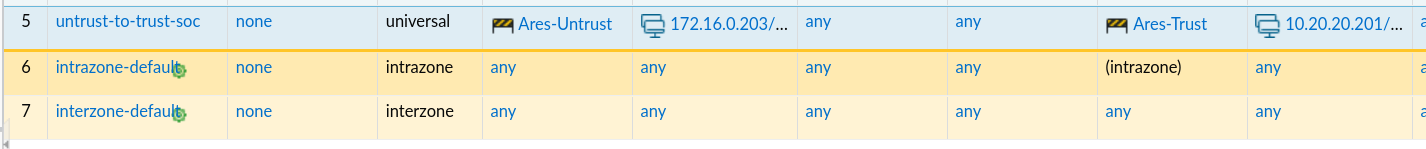
- A firewall rule — I added a security policy on the Palo Alto permitting my access zone to reach the console’s address on the Trust side, scoped as tightly as I could: one source, one destination, one port. This is the permission piece. It tells the firewall it’s allowed to pass that traffic.
- A route — separately, my workstation’s network didn’t know that Trust-zone traffic should go through the firewall at all. It was sending those packets to my internet edge gateway, which has no idea the Trust network even exists, so they simply vanished. Adding a specific route — “for the Trust subnet, send traffic to the firewall” — fixed the direction. This is the path piece.
The distinction matters: a permission without a path is useless, and so is a path without permission. I needed both. The symptom of missing either one looks identical — the connection just times out — which is what made it briefly confusing. The giveaway was that nothing showed up in the firewall’s traffic logs at all, which told me the packets weren’t even reaching the firewall: a routing problem, not a permission problem. Once the route pointed Trust-bound traffic at the firewall, the rule could finally do its job, and the console loaded.
In hindsight this is one of those security-by-default wins that’s easy to resent in the moment and appreciate afterward. The firewall made me deliberately authorize and route every bit of access to my monitoring infrastructure. That’s friction, but it’s the right friction — it’s exactly the discipline you’d want protecting a real sensor.
A caveat worth being honest about: allowing traffic from Untrust into Trust is backwards from how you’d run this in production — Untrust is supposed to be the hostile side. In a real deployment, management access to the sensor would come from a dedicated management zone, not by reaching in from Untrust. For a single-host lab I accepted that tradeoff and scoped the rule as tightly as possible, but it’s a shortcut, not a pattern to copy.
Where Things Stand
At this point, Security Onion is installed, running cleanly, and reachable from my browser. I can log into the console and look around.
But it’s important to be precise about what that does and doesn’t mean: the sensor isn’t actually watching anything yet. The monitoring connections exist, but nothing is being mirrored to them — I’ve built the road and parked the car, but haven’t pointed any traffic down it. Right now it’s a detection engine staring at an empty wire.
That’s the next piece of work, and it’s the payoff for all the OVS groundwork: configuring the mirrors so a copy of the DMZ and Trust traffic actually flows to the sensor, and then — the quick, low-cost win from Path 1 — turning on Palo Alto log forwarding so the firewall starts shipping its own records over as well. That’s where this finally goes from “installed” to “monitoring”.
Feeding the Sensor — Mirroring Traffic to Security Onion
The principle behind network security monitoring is that the sensor inspects a copy of traffic, not the traffic itself. It sits off to the side, silently receiving duplicates of everything crossing the network, while the real packets continue on their way untouched. The sensor is a passive observer — if it died, the network wouldn’t notice.
The challenge in a virtualized setup is producing that copy. Back in the setup post I converted my DMZ and Trust bridges to Open vSwitch precisely so I could do this. OVS can take a bridge and mirror its traffic to a designated port — the virtual equivalent of a switch’s SPAN port. That groundwork is what makes this step possible at all; without it, there’d be no way to hand the sensor a copy of anything.
So the job here is to create two mirrors: one copying all DMZ traffic to the sensor’s DMZ monitor, and one copying Trust traffic to its Trust monitor.
Building the Mirrors
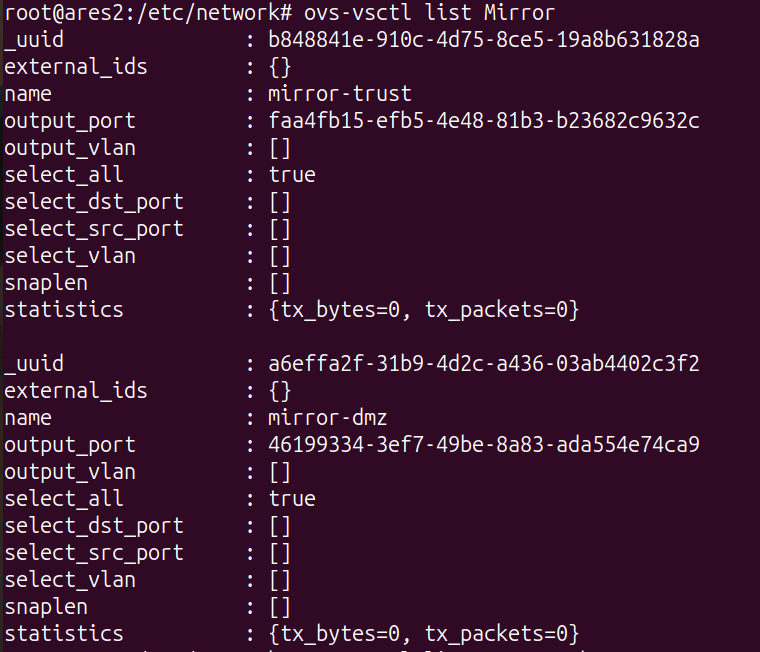
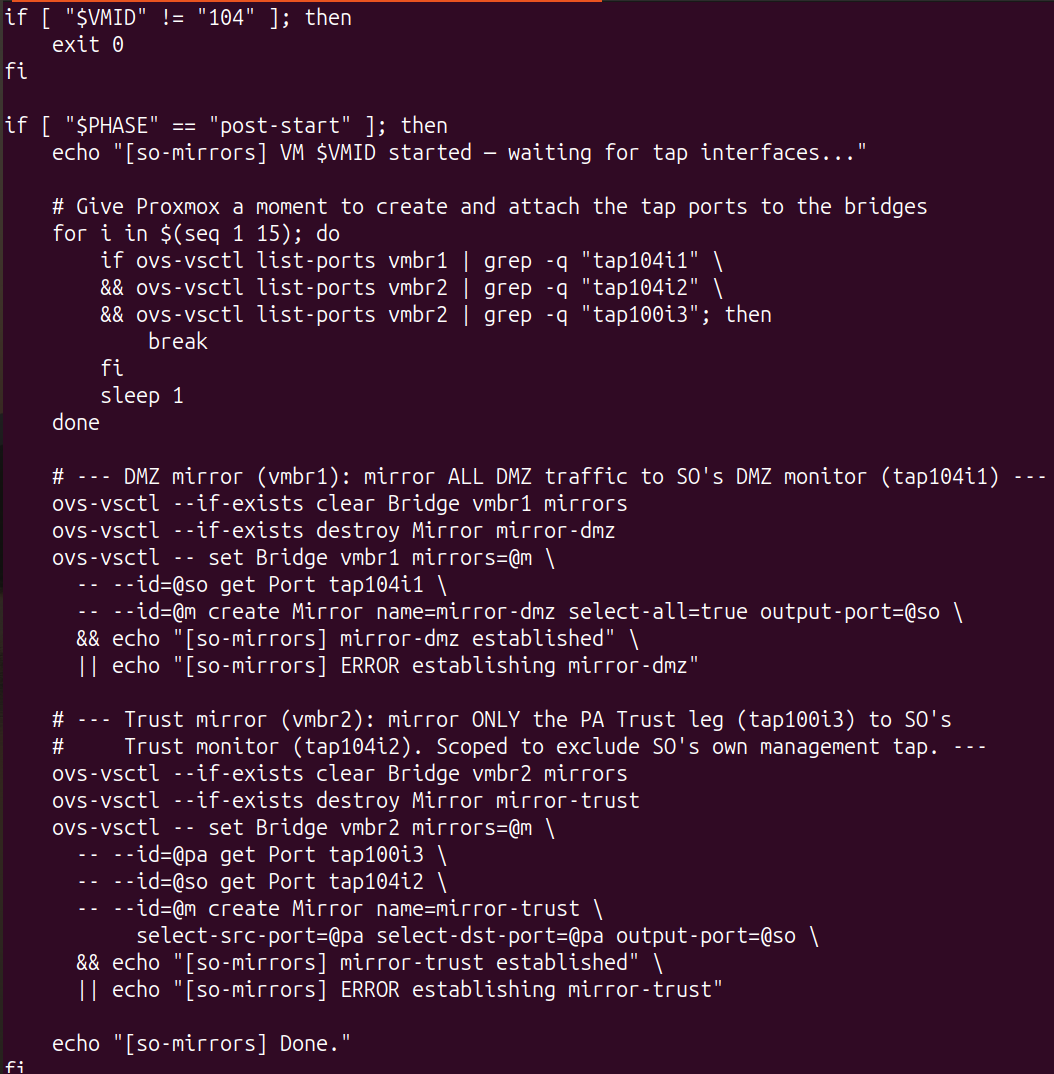
Each mirror is a small rule attached to a bridge that says, in effect: take traffic crossing this bridge and send a copy to this port. I built one for the DMZ bridge and one for the Trust bridge, each pointed at the matching monitoring connection on the Security Onion VM.
The DMZ mirror was straightforward. I told it to copy everything crossing the DMZ bridge — every packet, in both directions — to the sensor. That captures the public-facing servers talking to each other, talking out through the firewall, and even the background chatter most people forget exists: ARP, DHCP, IPv6 discovery. All of it now lands on the sensor.
 The Trust mirror needed a moment’s more thought, and it taught me something worth sharing.
A Subtle Mistake — The Sensor Watching Itself
My first instinct was to mirror the Trust bridge the same blunt way: copy everything. But the Trust bridge is different from the DMZ bridge in one important respect — the sensor’s own management connection lives on it. The management connection is how the sensor receives logs and serves its console; it’s the sensor being a normal participant on the network, not traffic I want to inspect.
When I mirrored everything on the Trust bridge, I was therefore copying the sensor’s own management traffic back into the sensor. It was watching itself work. Every console click, every log query, every bit of its own housekeeping was getting captured and analyzed as if it were network activity worth investigating.
That’s a problem for two reasons. The obvious one is noise — the logs fill with meaningless self-referential chatter that buries the signal you actually care about. The subtler one is that it’s conceptually wrong: a sensor’s job is to watch the network, not itself. Letting it monitor its own management plane pollutes the very data you’re trying to keep clean.
The fix was to stop mirroring blindly and instead scope the Trust mirror to a specific source: the firewall’s connection to the Trust zone. Because every device in the Trust zone routes through the firewall, mirroring just the firewall’s Trust-side traffic captures essentially all the real activity on that network — while leaving the sensor’s own management connection out of the picture entirely. One precise rule instead of one blunt one.
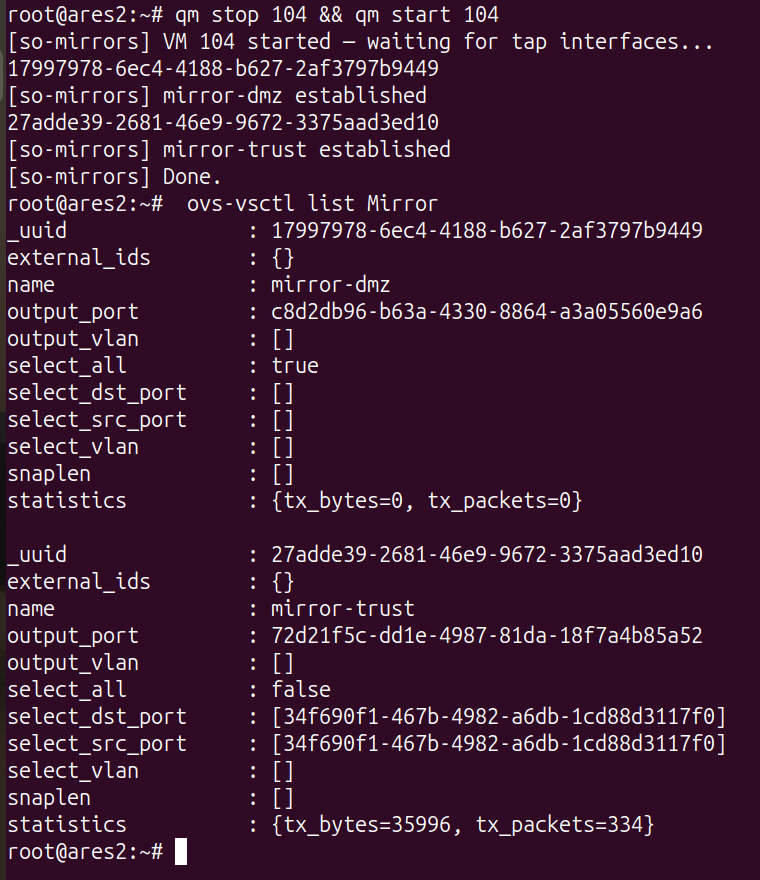
Notice how the trust mirror select-all tag says false this time?
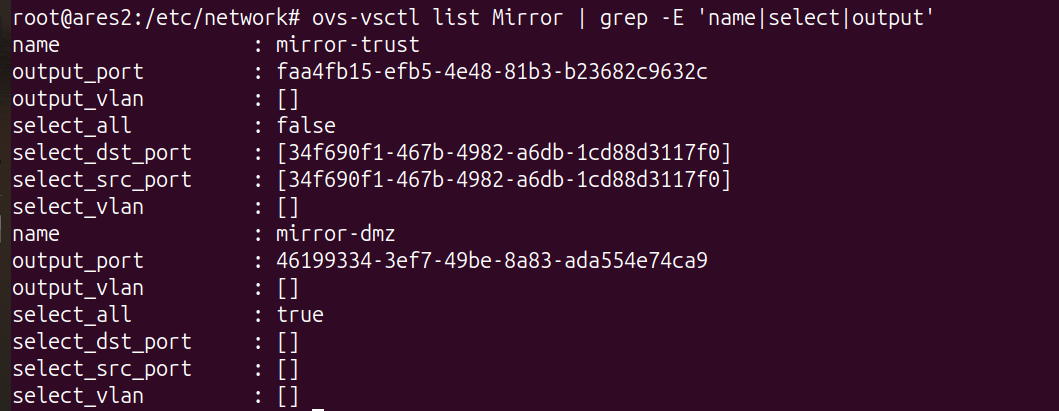
The asymmetry between my two mirrors ended up being deliberate and correct: the DMZ mirror copies everything because nothing on that bridge needs excluding, while the Trust mirror is scoped because the sensor’s own management presence has to be kept out. Same goal, different rule, because the two bridges aren’t the same situation. It’s a small thing, but it’s the kind of detail that separates a sensor that produces clean data from one that drowns in its own reflection.
Proving It Works
Configuring a mirror and confirming a mirror are two different things, and with security tooling the difference matters — a sensor that looks healthy but sees nothing is worse than no sensor at all, because you trust it without reason to.
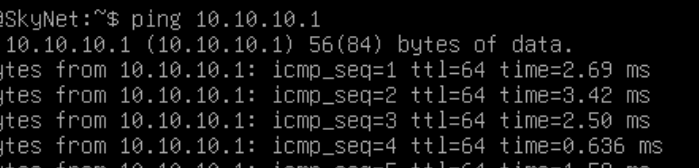
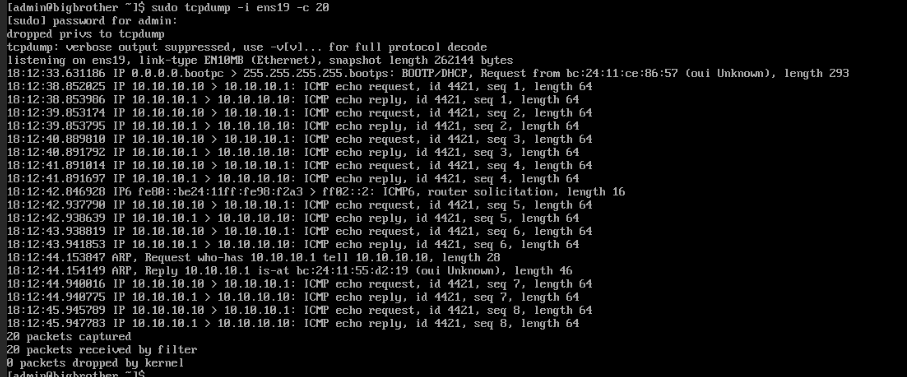
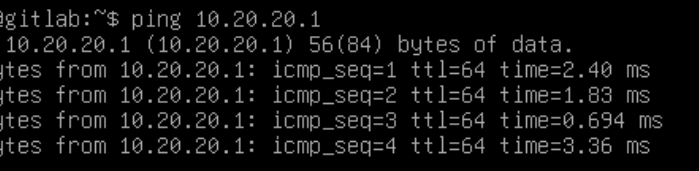
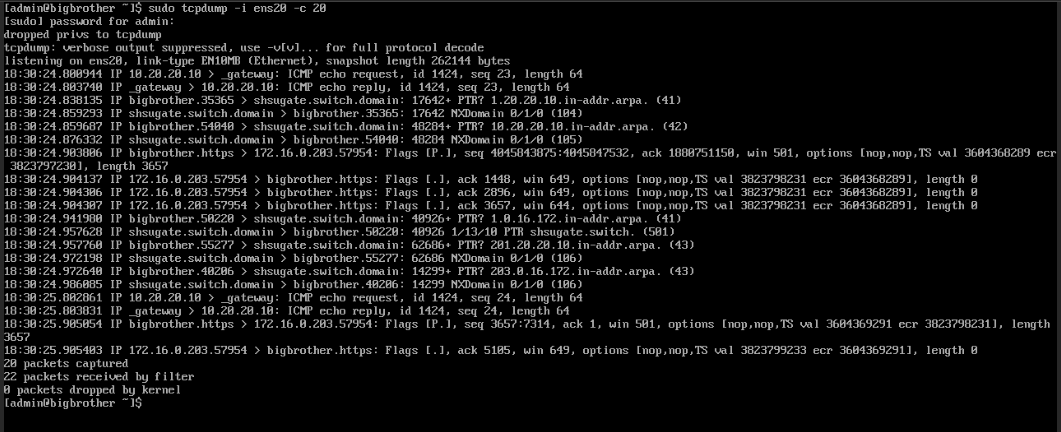
So I verified at three levels. First, raw packets: I generated traffic between zones — pinging across the network from hosts in the DMZ and Trust segments — and confirmed the sensor’s monitoring connections were actually receiving those packets. Watching a ping I sent from a DMZ host show up in a live capture on the sensor, a machine that isn’t in the path of that traffic at all, is a genuinely satisfying moment. It means the copy is working.
Second, the ambient traffic. Alongside my test pings, the capture showed DHCP requests, ARP lookups, and IPv6 router solicitations I never generated — proof that I was seeing the whole segment’s real activity, not just my own deliberate tests.
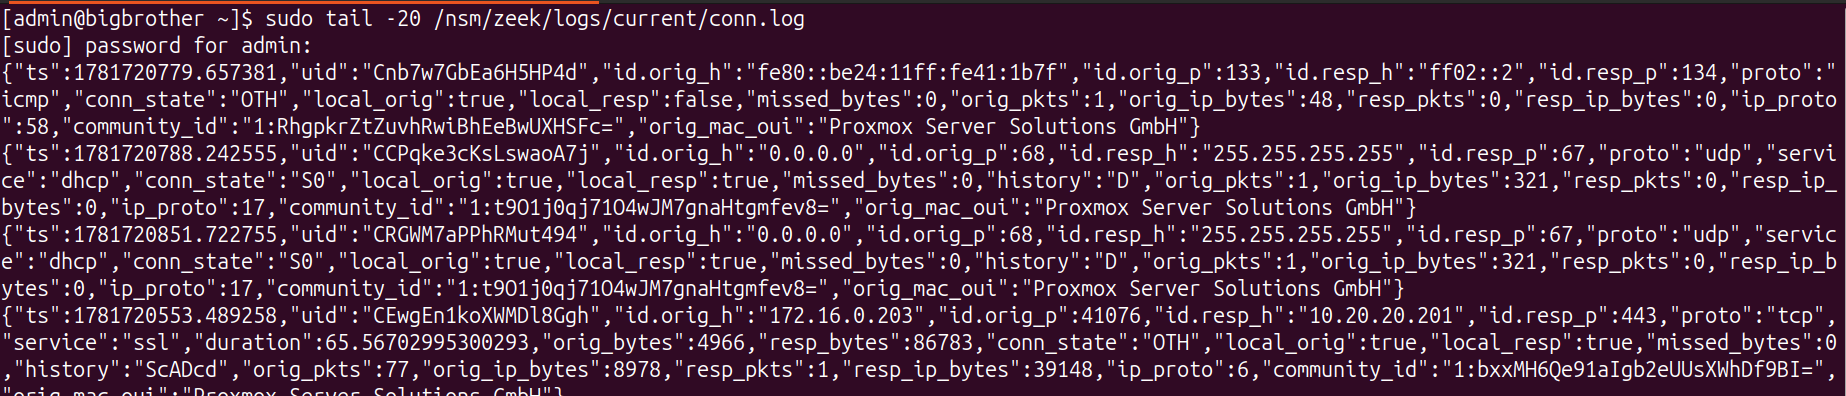
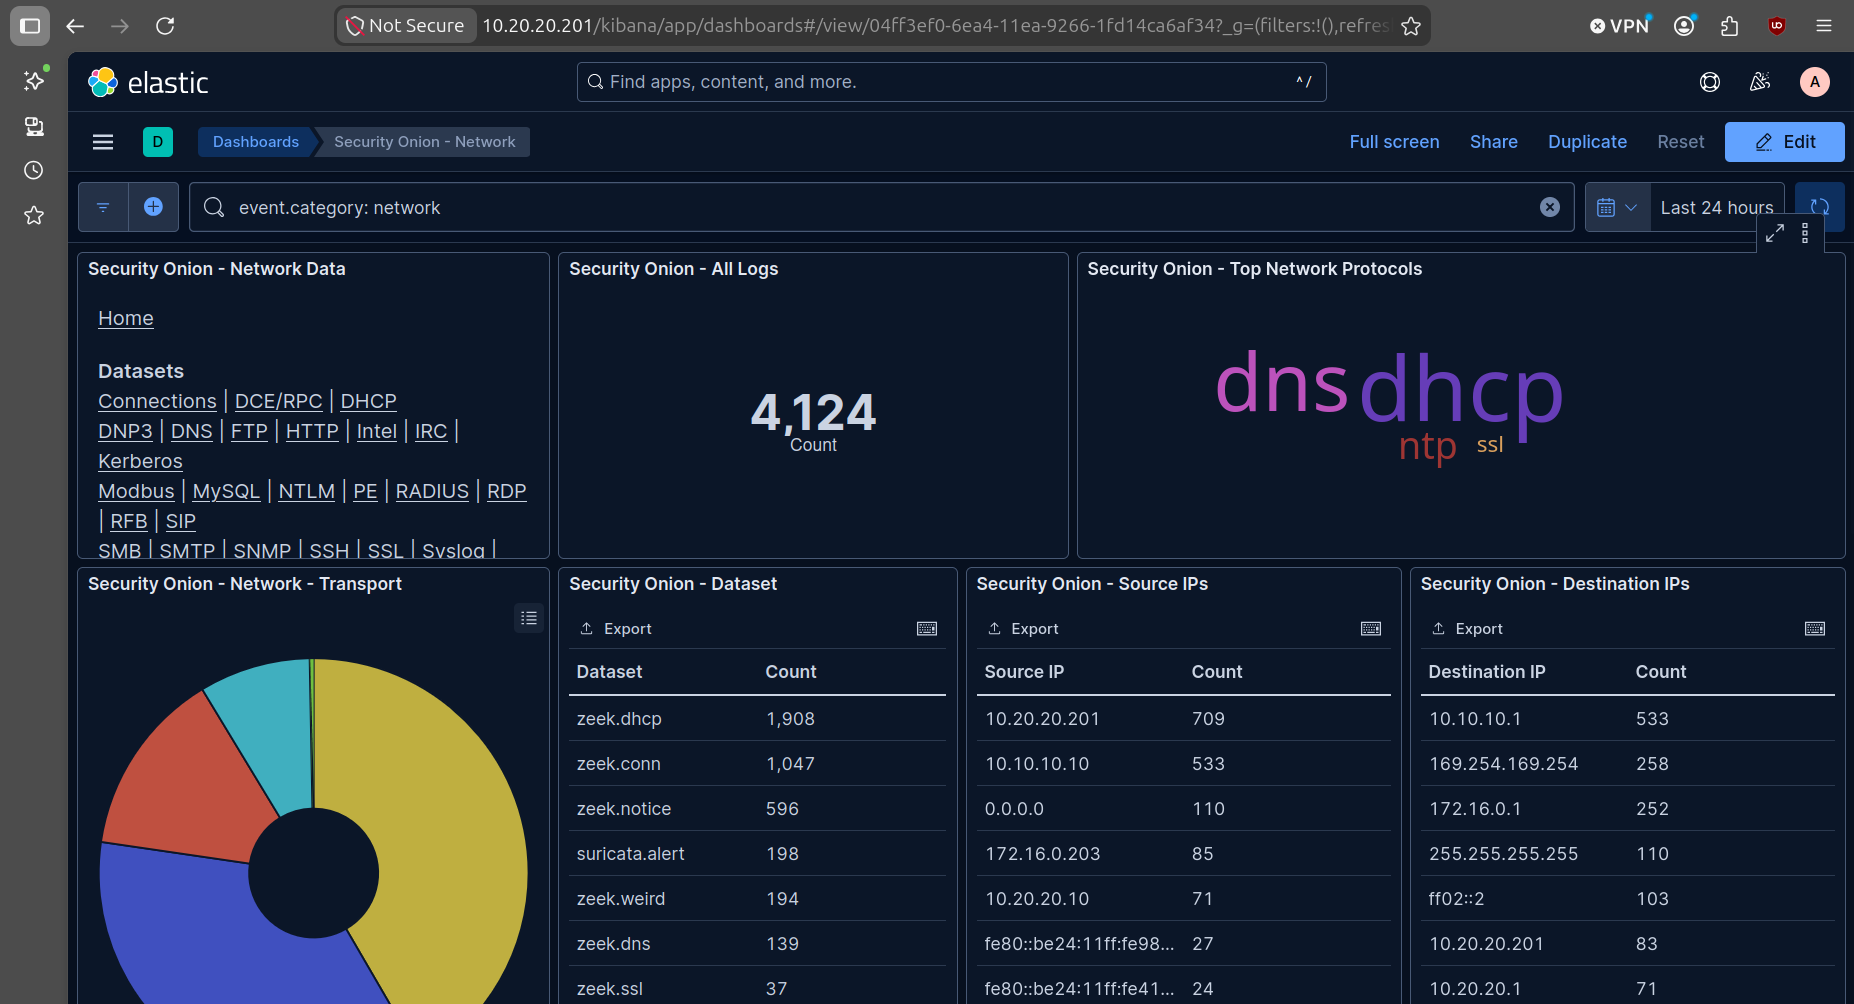
Third, and most important: the detection engine itself. It’s one thing for packets to arrive on a wire; it’s another for the analysis engine to parse them into meaning. I checked the connection logs and found structured records being written for the traffic I’d generated — each one identifying the protocol and service (DNS, DHCP, NTP, SSL), tracking the connection’s state, and recording byte counts and timing. That’s the whole point. The sensor isn’t just receiving packets, it’s understanding them.
End to end, the chain works: traffic crosses a bridge, the mirror copies it to the sensor’s monitor port, the sensor’s engine ingests it, and structured logs come out the other side. That’s a functioning network sensor.
The Detail Everyone Forgets — Making It Survive a Reboot
There’s one last step that’s easy to skip and dangerous to skip: the mirrors I built were temporary. They lived only in the running state of the virtual switch. The moment the host rebooted or the sensor VM restarted, the virtual ports would be recreated and the mirrors would quietly disappear — leaving me with a sensor that looks perfectly healthy but is actually blind.
For a security tool, that’s the worst possible failure mode. A sensor that’s obviously down gets fixed. A sensor that silently stopped watching, while its dashboard still shows green, gives you false confidence — you think you have coverage you don’t. The blind spot you don’t know about is far more dangerous than the one you do.
So I made the mirrors persistent. I wrote a small script that the virtualization platform runs automatically every time the sensor VM starts. It waits for the virtual ports to come up, then rebuilds both mirrors exactly as configured. Now a reboot doesn’t cost me visibility — the monitoring re-arms itself without any intervention.
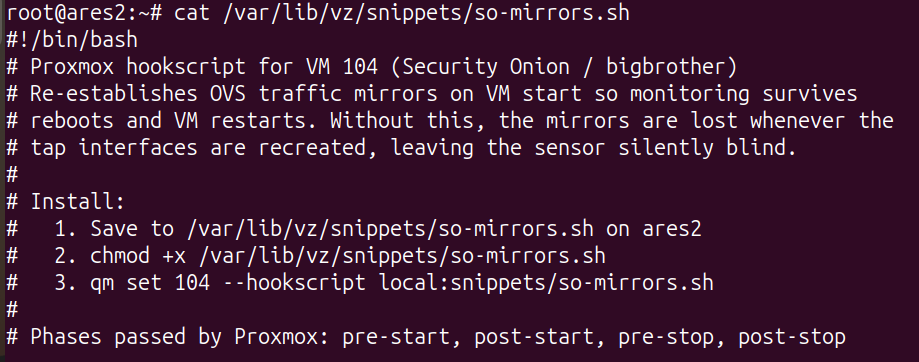
And critically, I tested it rather than assuming it worked: I deliberately restarted the sensor VM and confirmed both mirrors came back on their own, with no manual commands. An untested safety net isn’t a safety net. With that confirmed, the monitoring is durable — I can reboot the whole host and trust that the sensor wakes up watching.
Where Things Stand
With this, the deeper of my two data paths is complete. Security Onion is now inspecting a live copy of both my DMZ and Trust traffic, parsing it into structured logs, and it survives a reboot without me lifting a finger. The hard half — the half I said upfront that most people underestimate — is done and verified.
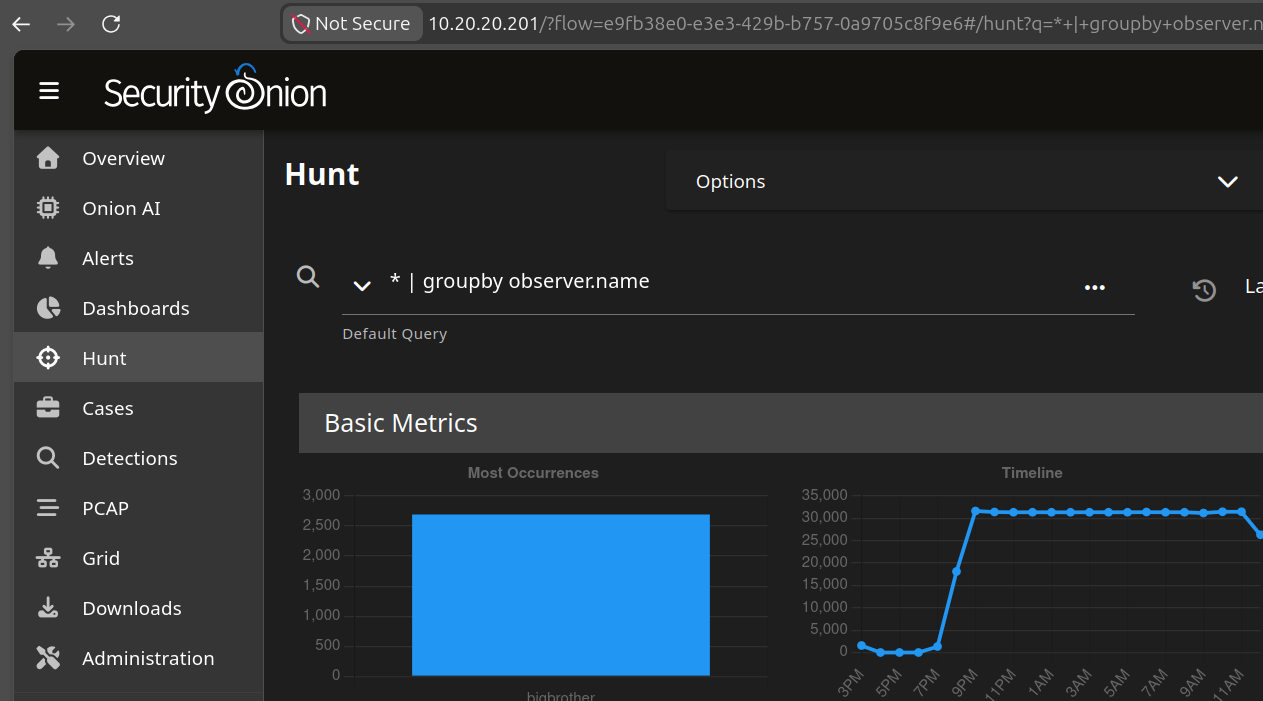
And the dashboard proves it. After all that groundwork, the sensor went from staring at an empty wire to ingesting real traffic — Zeek connection logs, parsed and searchable, sitting alongside the platform’s own telemetry.
That leaves Path 1 — the fast, low-cost win I promised back at the start: having the Palo Alto forward its own logs to Security Onion. It’s a configuration change rather than an architecture decision, and it adds the firewall’s own record on top of the raw traffic I’m already capturing. Two views of the same network — the sensor’s independent inspection of what actually crossed the wire, and the firewall’s account of what it decided to allow or deny — feeding one place, where they can be searched together.
That’s the next post.