GRC-as-Code: Automating CIP-010 Baselines and Evidence
The part I don't see written up much — automating CIP-010 configuration baselines and drift detection in Python and Ansible, and building an evidence-collection pipeline that produces RSAW-style packages instead of screenshots.
Everything in this series so far I built by hand: clicking through consoles, running commands, pasting screenshots. That’s fine for one small lab. It falls apart the moment you’re a real utility with hundreds of machines and an auditor at the door asking you to prove that none of them have changed since you last checked.
That question is harder than it sounds. Regulators don’t want your assurance, they want evidence, and from what I’ve read, a lot of that evidence still gets produced the hard way: a person, a spreadsheet, and a deadline. The spreadsheet is out of date the day after it’s written, and everyone involved quietly knows it.
So this post does the opposite. I treat compliance as a software problem, which people call GRC-as-code (GRC is the industry’s term for Governance, Risk, and Compliance, basically the paperwork side of security). The specific regulation is CIP-010, which says a utility has to know the exact configuration of every critical machine and detect when it changes. I automate that: a pipeline that fingerprints every machine on a schedule, flags anything that drifted, and produces the audit evidence as a by-product of running, instead of as a document someone writes up afterward.
Most write-ups I found stop at the checklist, not the automation. That’s the part I wanted to try.
Where this fits. Post 6 of the series. CIP-010 is the most automatable control in the whole standard, which makes it the natural home for the scripting and tooling I actually enjoy.
What is CIP-010?
CIP-010 (Configuration Change Management and Vulnerability Assessments) requires Responsible Entities to know, and keep knowing, the exact configuration of their BES Cyber Systems. The parts I’ll automate:
- R1 — baseline configuration. Establish a documented baseline for each asset: operating system, installed software, logical ports/services, and security patches.
- R2 — drift detection. Detect changes from that baseline and confirm they were authorized.
- R3 — vulnerability assessments. Periodically assess the systems for vulnerabilities.
The manual version of this is a spreadsheet someone updates by hand and nobody really trusts. The automated version is a repeatable pipeline where the output itself is the evidence.
Why GRC-as-code
Three reasons the automation matters more than the checklist:
- Repeatability. A baseline you collect by hand is stale the day after you collect it. A collection you run on a schedule is always current.
- Trustworthy evidence. An auditor trusts a diff generated by a pipeline more than a screenshot that could be from anytime.
- It scales. The same play that baselines one OT VM baselines fifty just as easily. That’s what makes it a program rather than a one-off lab.
flowchart LR
    assets["BES Cyber Assets<br/>(OT + mgmt VMs)"] --> collect["Ansible: collect baseline<br/>(OS, software, ports, patches)"]
    collect --> store["Version-controlled<br/>baseline (git)"]
    store --> diff["Python: diff vs. prior<br/>(drift detection — R2)"]
    diff -->|"drift found"| alert["Flag for review<br/>(authorized change?)"]
    alert --> siem["Splunk SIEM<br/>(beside the CIP-015 data)"]
    diff --> evidence["Evidence package<br/>(RSAW-style — dated + hashed)"]
An RSAW (Reliability Standard Audit Worksheet) is the actual form a utility fills in to demonstrate compliance with a given standard; it’s the thing an auditor reads. When I say my pipeline emits “RSAW-style” evidence, I mean its output is shaped to answer the questions that form asks, instead of being a pile of logs someone still has to translate.
Setting it up
Two tools carry this, and both are worth a sentence if you haven’t met them. Ansible is an automation tool that connects to a list of machines over SSH and runs a defined set of steps against each one, with no agent to install, and the steps live in a plain YAML file you can read. Git is version control: it stores every version of a file and can show you exactly what changed between any two points in time. Put them together and you’ve basically got this whole post: Ansible goes and looks, Git remembers what it saw, and the difference between two Git commits is your drift report.
-
Automate baseline collection (R1). An Ansible play gathers the four baseline elements from each asset and writes them to a structured, version-controlled file, one per asset, committed to git so the history is the change record. The OT assets live inside the ESP, so the play reaches them over SSH through the
mgmt-jumpIntermediate System, the same guarded path an operator uses, while the management-zone systems are reachable directly.1 2 3 4 5 6 7 8 9 10 11 12 13 14
# baseline.yml — collect the CIP-010 R1 elements - hosts: baseline_targets gather_facts: true tasks: - name: Enumerate installed packages ansible.builtin.package_facts: - name: Enumerate listening ports/services ansible.builtin.shell: "ss -tulnH | awk '{n=split($5,a,\":\"); print $1\"/\"a[n]}' | sort -u" register: ss_ports - name: Write the version-controlled baseline artifact ansible.builtin.copy: content: "" dest: "baselines/.json" delegate_to: localhost
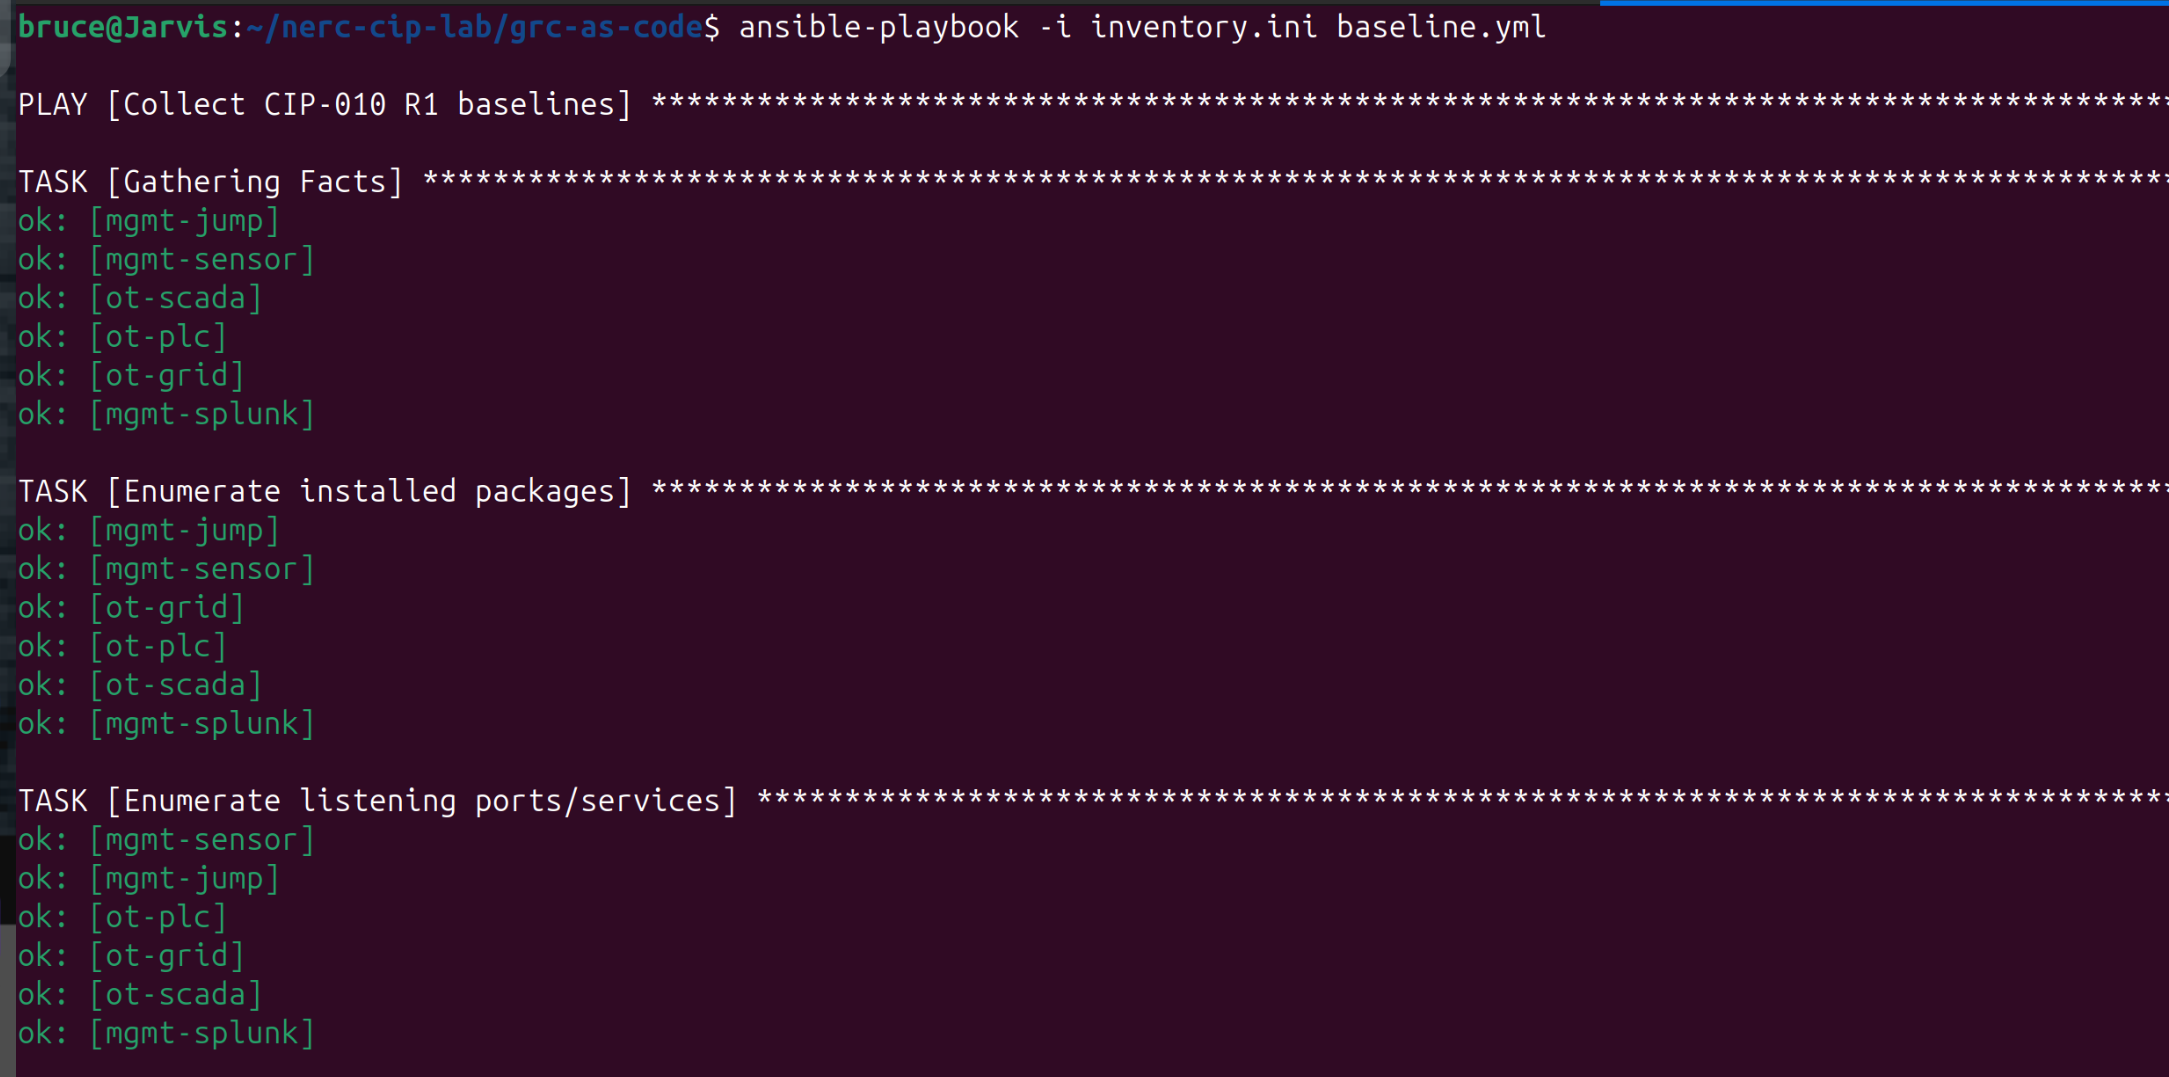 Caption: OS, packages, ports, and patch level captured per asset — the R1 baseline.
 -
Detect drift (R2). A small Python script diffs today’s collection against the committed baseline and classifies each change.
1
2
3
4
5
6
7
8
# drift.py — compare the committed baseline (git HEAD) to the live collection
prior = json.loads(subprocess.check_output(
    ["git", "show", f"HEAD:baselines/{asset}.json"]))
current = json.loads(Path(f"baselines/{asset}.json").read_text())

for port in sorted(set(current["listening_ports"]) - set(prior["listening_ports"])):
    print(f"PORT  opened: {port}")        # same idea for packages and the OS
# ...exit non-zero if anything drifted, so cron or CI flags it automatically
Reading the prior state straight out of
git show HEAD:is the key part: the baseline isn’t some file I’m trusting to be current, it’s just the last thing the pipeline committed, and the diff against it is the drift.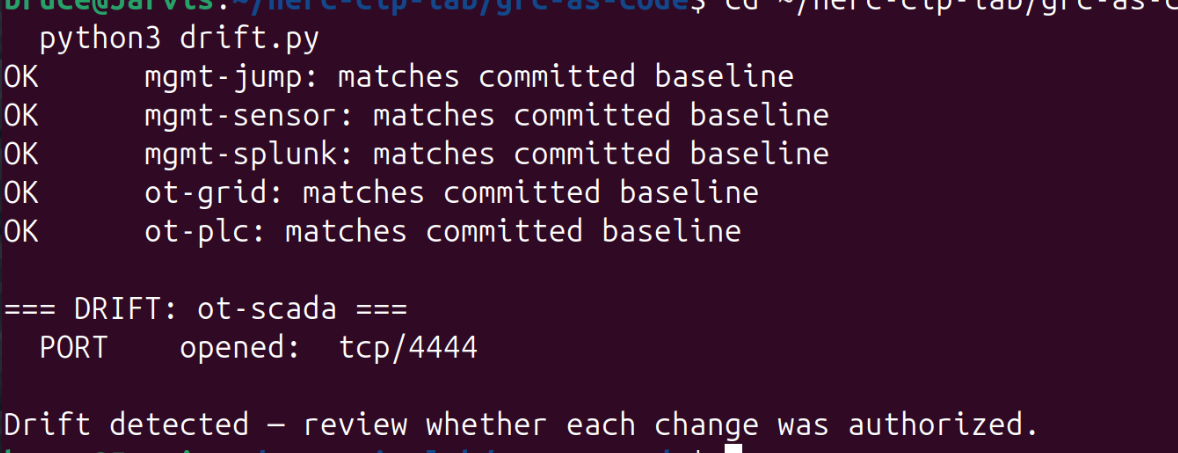 Caption: drift surfaced automatically — now: was this an authorized change?
 -
Wire it to a schedule. Run the collect-and-diff on a cron (or CI) so drift is caught within a day, not at the next audit. Feed alerts into Splunk alongside the CIP-015 data from post 5.
Example: catching an unauthorized change
To prove it works, I make a change an attacker (or a careless admin) might: open an unexpected listening port on the SCADA master — a rogue backdoor. The next scheduled run catches it.
1
2
3
4
5
6
7
8
9
# simulate an unauthorized change on a BES Cyber Asset — a rogue listener
ssh ot-scada 'setsid python3 -m http.server 4444 &'

# the next scheduled collect + diff catches it, and forwards it to the SIEM
ansible-playbook -i inventory.ini baseline.yml --limit ot-scada
python3 drift.py --splunk
# === DRIFT: ot-scada ===
#   PORT    opened:  tcp/4444
#   -> forwarded 1 finding(s) to Splunk (index=ot_insm)        [exit 1]
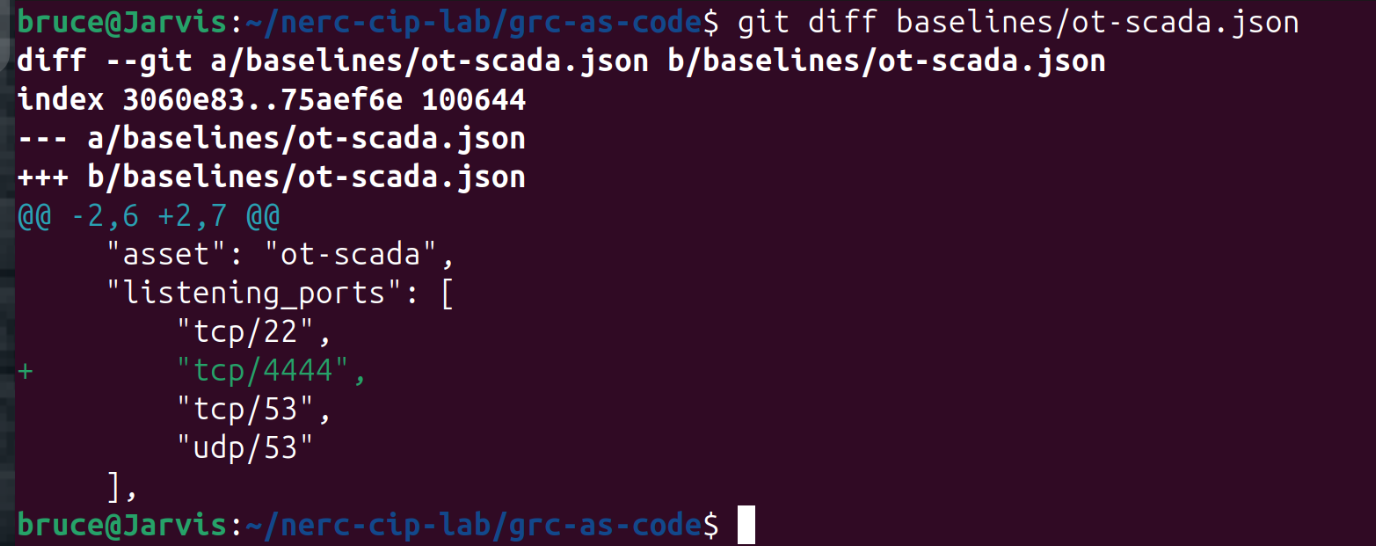 Caption: an unauthorized listening port caught by the pipeline, not by luck.
This lines up with post 5: CIP-015 catches the malicious traffic, and CIP-010 catches the malicious change to the system itself. Two independent tripwires on the same intrusion.
The evidence pipeline (RSAW-style output)
An auditor doesn’t care about your scripts, they want the evidence. The final stage turns each run into a dated, attributable evidence package shaped like the Reliability Standard Audit Worksheet (RSAW) evidence a real assessment produces: which control, which asset, the baseline summary, the drift diff, timestamps, and who ran it, plus the git commit the baseline came from and a SHA-256 of the file, so the evidence is verifiable and not just readable. It’s a single self-contained HTML file that prints cleanly and needs nothing but a browser to open.
1
2
python3 evidence.py --control CIP-010-R2 --asset ot-scada
# -> evidence/CIP-010-R2_ot-scada_2026-07-23.html
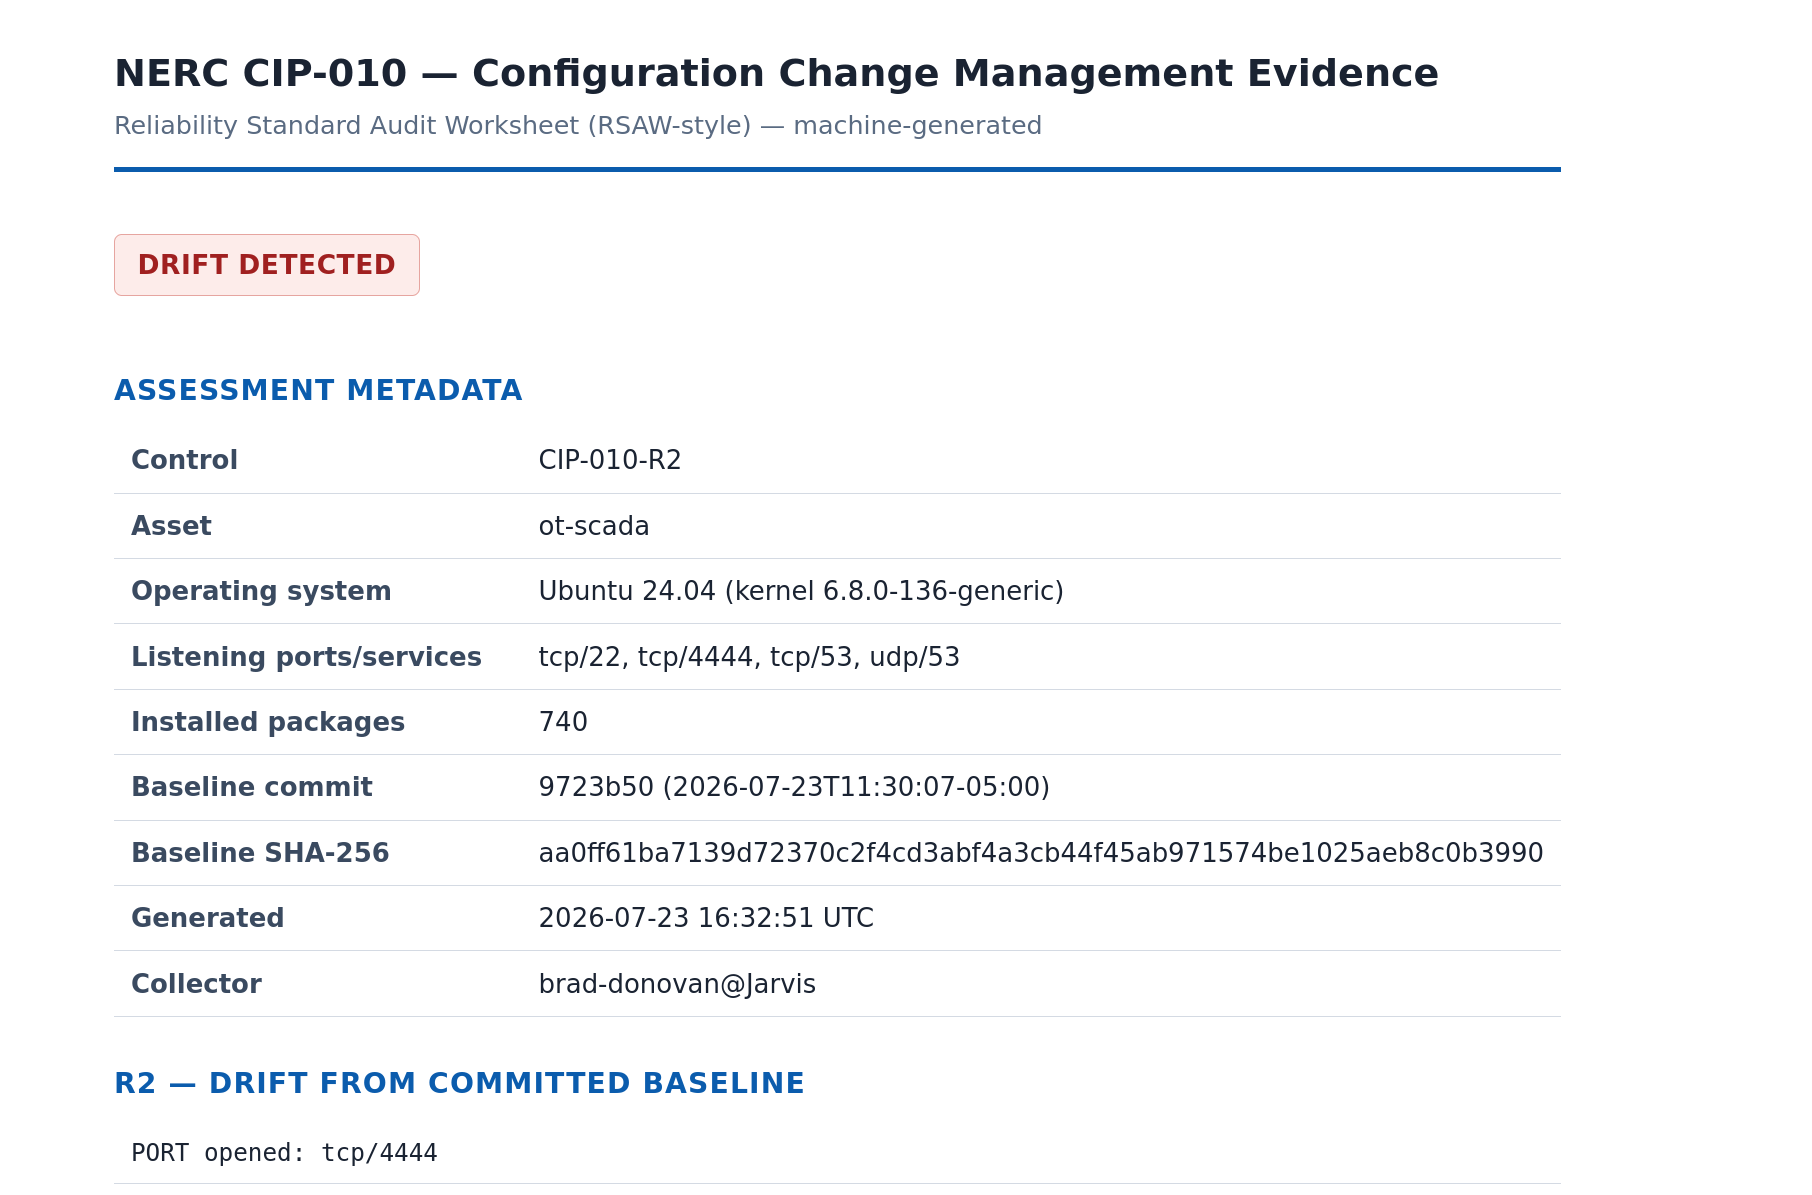 Caption: machine-generated, timestamped evidence — the control, the asset, the drift, and an
integrity block (baseline commit + SHA-256). The artifact an assessor actually consumes.
Caption: machine-generated, timestamped evidence — the control, the asset, the drift, and an
integrity block (baseline commit + SHA-256). The artifact an assessor actually consumes.
Both tripwires in one place: CIP-010 meets CIP-015 in the SIEM
A drift finding that only prints to a terminal is gone the moment you close that terminal. The
--splunk flag on drift.py forwards each finding into the SIEM, into the same index the Zeek and
Suricata data from post 5 already flows into. That one decision
is what pulls two separate controls into a single picture.
Here’s why that matters. Back in post 3, ot-scada (10.10.20.12) sent
a rogue DNP3 breaker command to the outstation, and post 5’s INSM sensor caught that: the traffic.
Now the same asset has an unauthorized listening port, and CIP-010 catches that: the configuration.
Two separate tripwires, tripped by activity on the same machine, and for the first time they sit
side by side on one screen:
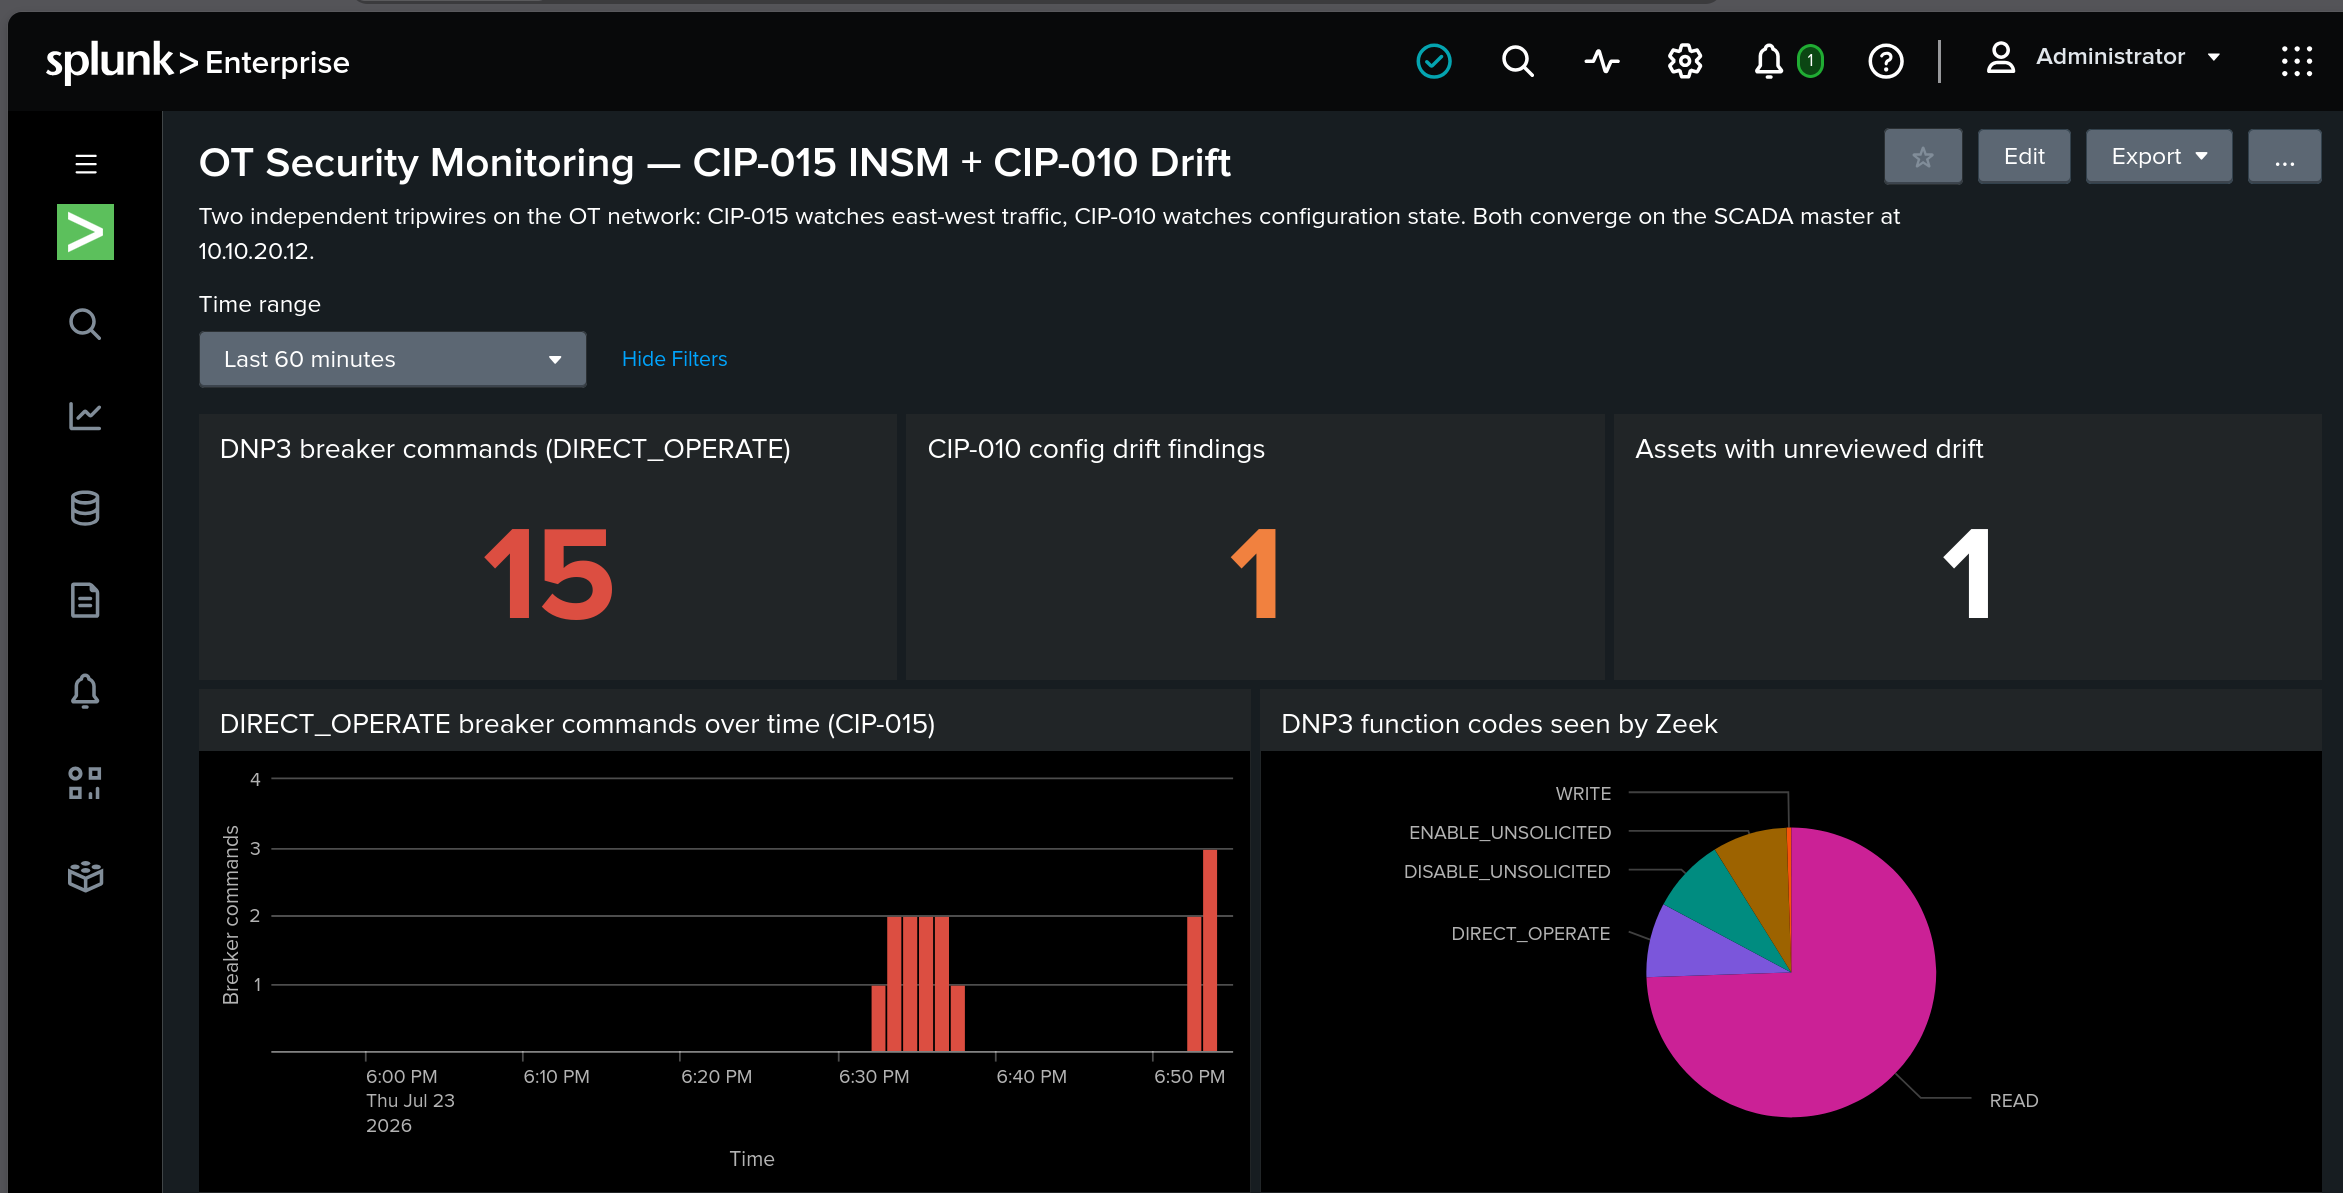 The top of the board: 15 DIRECT_OPERATE breaker commands and a single open drift finding, the
command burst plotted over time, and the DNP3 function-code mix — the CIP-015 sensor’s view of the
OT network.
The top of the board: 15 DIRECT_OPERATE breaker commands and a single open drift finding, the
command burst plotted over time, and the DNP3 function-code mix — the CIP-015 sensor’s view of the
OT network.
The lower half is where the two controls actually meet:
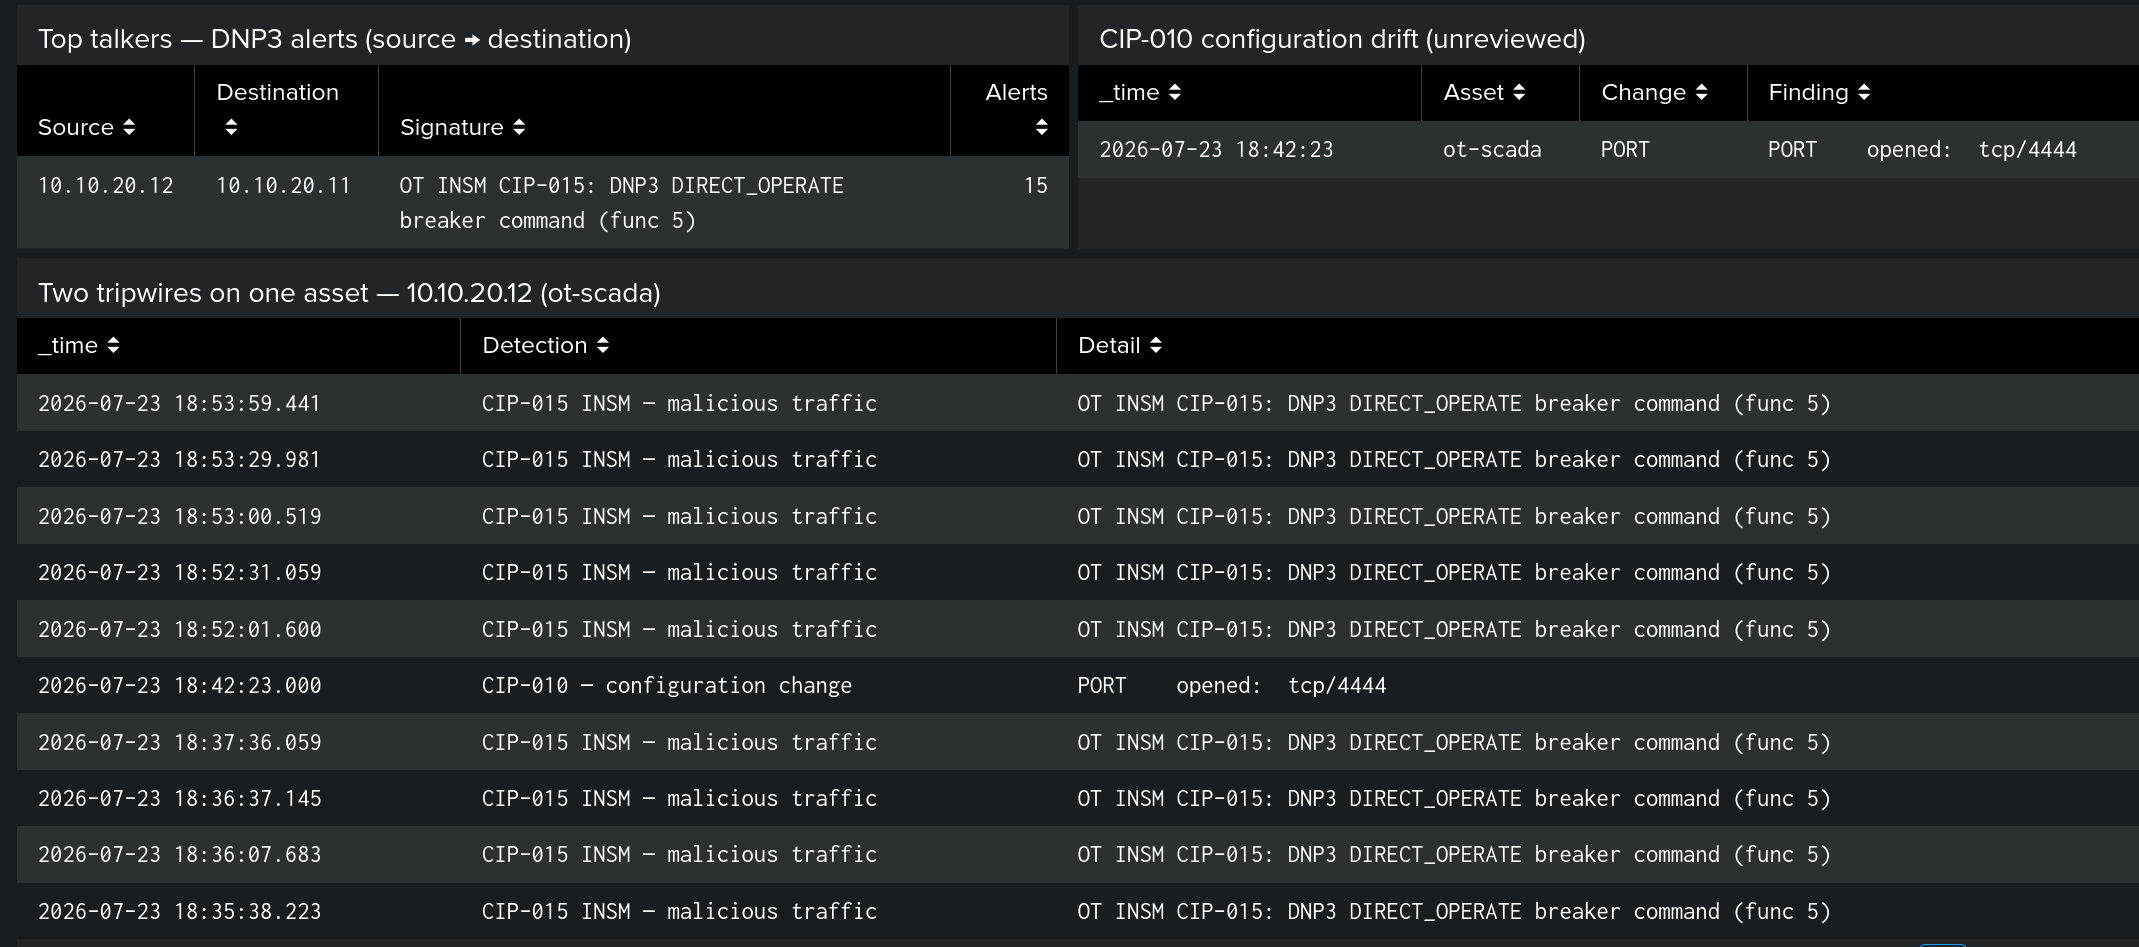 The drift table (from this post’s pipeline) shows the one unreviewed change; the convergence panel
interleaves it with the CIP-015 alerts. Every detection tied to
The drift table (from this post’s pipeline) shows the one unreviewed change; the convergence panel
interleaves it with the CIP-015 alerts. Every detection tied to 10.10.20.12, network and host, in
one view — the rogue breaker commands and the backdoor port, the same asset caught two ways.
Neither control saw the whole attack. CIP-015 watched a command cross the wire but knows nothing about the backdoor port; CIP-010 watched the port appear but never saw a packet. An analyst looking at either one alone only sees half the intrusion. Put together in the SIEM, the two halves describe the same attacker, and that’s the whole reason to make compliance produce machine-readable output instead of screenshots.
The CIP-010 assessment: current state → finding → risk → remediation
| Control | Current state | Finding | Risk | Remediation |
|---|---|---|---|---|
| R1 baseline | Ansible-collected, git-versioned | Baselines cover OT/mgmt VMs only | Shadow assets uncaptured | Tie collection to CIP-002 inventory |
| R2 drift | Scheduled diff, alerts to Splunk | No auto-link to change tickets | Authorized vs. rogue is manual | Correlate drift with change records |
| R3 vuln assessment | Not yet automated | Point-in-time, manual scans | Vulns linger between scans | Schedule authenticated scans into the pipeline |
Pros and cons
| Pros | Cons |
|---|---|
| Evidence is generated, dated, and trustworthy | Upfront engineering before it pays off |
| Drift caught in a day, not at audit time | Automation can drift too — the pipeline needs its own baseline |
| Same playbook scales from one asset to many | Distinguishing authorized vs. rogue change still needs process |
Wrap-up
CIP-010 is the control that got me thinking about compliance as software: the pipeline does the work, and the evidence falls out as a by-product of running it. That’s the part I found most useful to build — the move from passing an audit once to keeping the answer current without a person redoing it by hand.
There’s one frame left, and it’s the angle I had the hardest time finding written up anywhere — the entire lab is virtualized on KVM, so how do the CIP standards even apply under the new virtualization definitions? Next post I categorize the lab twice: under today’s asset model and under FERC Order 919.